
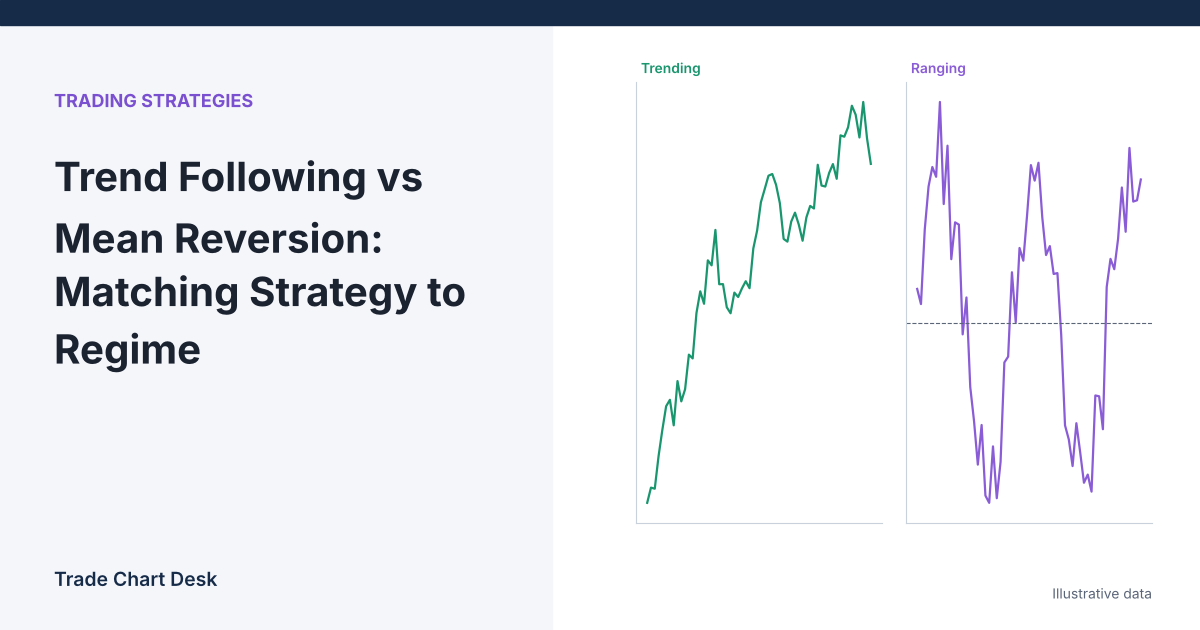
Here is a common way to lose money with two perfectly reasonable strategies. A trader buys breakouts for three months while Bitcoin grinds higher, and it works. The market then spends six weeks chopping inside a range, and the same breakouts fail one after another. The trader switches to fading moves at range edges, and it starts working, just in time for price to break out and run straight through every fade. Neither strategy was broken. Each was used in the wrong market. This article is about recognizing which market you are in, measuring it with numbers instead of impressions, and understanding what each approach costs you when you guess wrong.
Two bets about the next move
Strip away the indicators and each style is a single bet:
- Trend following bets that a move already under way is more likely to continue than to reverse. You buy strength, sell weakness, and accept that you will enter late and exit late.
- Mean reversion bets that a stretched move is more likely to snap back toward some average than to keep going. You buy weakness, sell strength, and accept that you are standing in front of the move.
Both bets can be right, just at different times. Academic work gives the trend side some footing: Moskowitz, Ooi and Pedersen’s “Time Series Momentum” (Journal of Financial Economics, 2012) found that returns in 58 futures markets tended to persist over 1 to 12 months and partially reversed over longer horizons. That is evidence about diversified futures over decades, not a promise about any single crypto chart, and the same paper notes the reversal side too. The practical point is that persistence and reversal both exist, on different timescales and in different conditions.
How the payoff profiles differ
The two styles do not just win at different times. They win in different shapes, and that shape is what you have to live with day to day.
| Trend following | Mean reversion | |
|---|---|---|
| Typical win rate | Low; many small losses | High; frequent small wins |
| Typical win size | Large relative to the loss | Small relative to the loss |
| Where the stop sits | Behind structure the trend should not break | Beyond the extreme you are fading |
| Worst environment | Tight, choppy ranges | Strong one-way trends, news shocks |
| Psychological pain | Long losing streaks | Rare but large losses |
| Example tools | Donchian breakouts, moving-average filters, trailing stops | Bollinger Band fades, RSI extremes, VWAP reversion |
Expectancy, with illustrative numbers
Expectancy per trade, measured in R (multiples of your initial risk), is win rate × average win − loss rate × average loss. Our risk-to-reward guide covers the formula in detail. These figures are invented to show the mechanics; they are not test results.
| Scenario | Win rate | Avg win | Avg loss | Expectancy |
|---|---|---|---|---|
| Trend system, trending market | 35% | 3.0R | 1.0R | 0.35 × 3.0 − 0.65 × 1.0 = +0.40R |
| Trend system, choppy market | 25% | 3.0R | 1.0R | 0.25 × 3.0 − 0.75 × 1.0 = 0.00R |
| Reversion system, ranging market | 65% | 0.8R | 1.2R | 0.65 × 0.8 − 0.35 × 1.2 = +0.10R |
| Reversion system, trending market | 50% | 0.8R | 1.6R | 0.50 × 0.8 − 0.50 × 1.6 = −0.40R |
Notice the asymmetry. When the trend system meets the wrong regime, its win rate drops but its loss size stays fixed, so it bleeds slowly toward breakeven. When the reversion system meets the wrong regime, its losses get bigger (price runs past the stop, or the trader widens it), and expectancy flips sharply negative. That is why the most damaging mistake is usually fading a strong trend, not chasing a range.
Measuring the regime instead of guessing it
“It looks trendy” is not a measurement. Two simple numbers give you something you can write down and compare over time.
1. Efficiency ratio (net move ÷ total path)
Perry Kaufman’s efficiency ratio, used inside his adaptive moving average, compares how far price got with how far it travelled to get there. Over N bars:
ER = |Closenow − CloseN bars ago| ÷ sum of |bar-to-bar close changes|
Two illustrative 10-bar sequences:
- Market A closes: 100, 102, 101, 104, 106, 105, 108, 110, 109, 112, 114. Net move = 14. Sum of absolute changes = 20. ER = 14 ÷ 20 = 0.70. Price went mostly in one direction.
- Market B closes: 100, 103, 99, 102, 98, 101, 104, 100, 103, 99, 101. Net move = 1. Sum of absolute changes = 33. ER = 1 ÷ 33 ≈ 0.03. Lots of movement, almost no progress.
Market B is not quiet; it moved 33 points in total. It is directionless. That is the environment where breakout entries get chopped up and fades at the edges look brilliant. You can compute ER in a spreadsheet from exported closes in a couple of minutes.
2. ADX for trend strength
The Average Directional Index measures trend strength without regard to direction. TradingView’s ADX reference describes the conventional reading: above 25 indicates a strong trend, and below 20 suggests a weak or trendless market, a threshold attributed to Welles Wilder. The zone between 20 and 25 is ambiguous, and treating it as “no strong opinion” is reasonable.
A simple decision procedure
- Pick one timeframe that matches your holding period (daily for swing trades, 4-hour for shorter swings).
- Read ADX(14) and the 20-bar ER on that timeframe.
- If ADX > 25 and ER > 0.4: trend tools only. Do not fade.
- If ADX < 20 and ER < 0.2: range tools are permitted, with stops beyond the range edge.
- Anything in between: reduce size or stand aside. Mixed readings are information, not an invitation to pick whichever style you feel like.
The ER cut-offs of 0.4 and 0.2 are starting points chosen for this example, not optimized values. Calibrate them on your own market and timeframe using the test below.
Where regime filters fail
- Both measures lag. ADX is built from smoothed averages, and ER looks back N bars. By the time ADX confirms a trend, part of it is over; by the time it confirms a range, the range may be ending. A filter reduces the number of wrong-regime trades, it does not remove them.
- Range breaks are where reversion dies. The highest-ER moves often start from the lowest-ER ranges. The last fade in a range is the one that meets the breakout. Our guide to false breakouts and retests covers how traders try to tell the difference.
- Timeframes disagree. A 1-hour range can sit inside a daily uptrend. If you fade the hourly range, you are fading against the daily trend. Decide which timeframe owns the decision before you look at the chart.
- Event shocks ignore regimes. Scheduled macro data, exchange incidents and liquidation cascades can turn a quiet range into a one-way move in minutes. A reversion stop needs to survive that or be sized as if it will not.
- Switching costs. Flipping styles every time the readings cross a threshold creates its own whipsaw. Many traders require the reading to hold for several bars before acting on it.
Test it on your own market
You do not need software beyond a charting platform and a spreadsheet.
- Export at least two years of daily closes for the market you trade.
- Add columns for 20-bar ER and ADX(14) (most charting tools will display ADX; copy the values or compute it in the sheet).
- Write one plain trend rule (for example, a 20-day breakout entry with a 10-day low exit) and one plain reversion rule (for example, buy a close below the lower Bollinger Band, exit at the middle band, stop at a fixed ATR multiple).
- Log every signal with the regime reading at entry. Do not skip trades that “obviously” would not have been taken.
- Group results by regime bucket and compute expectancy in R for each bucket.
If the trend rule does not do better in the high-ER bucket than in the low-ER bucket on your data, the filter is not adding anything for you, and you have learned that cheaply. Record the regime reading for live trades too; a trading journal with a “regime at entry” column often reveals that most of a trader’s losses come from one style used in one kind of market.
If you hold a long-term portfolio rather than trading signals, the regime question shows up differently: rebalancing is a built-in mean-reversion habit. Our article on crypto portfolio rebalancing works through what that costs in a trending market.
Financial disclaimer: This article is for educational purposes only and is not financial, investment, or trading advice. Trading involves substantial risk of loss. Example figures are illustrative.