
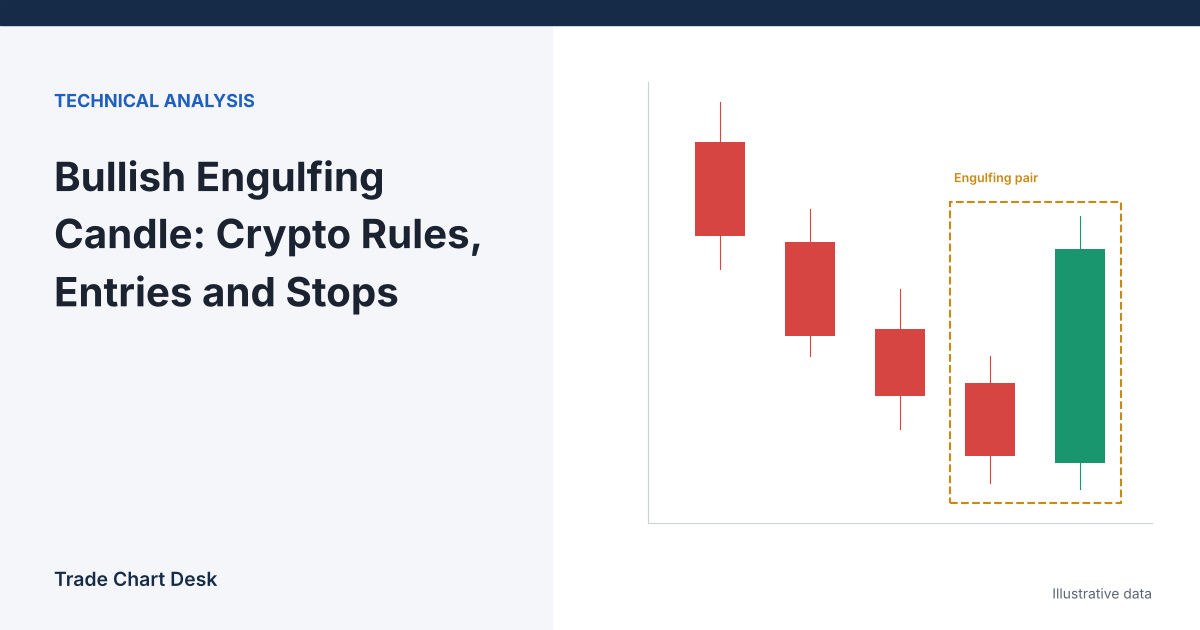
Here is a question that trips up most people who learn the bullish engulfing pattern from a stock-market book and then apply it to Bitcoin: if the second candle is supposed to open below the first candle’s close, why does that almost never happen on a BTC/USDT chart? The answer changes how you should define the pattern, where you enter, and where your stop goes. This article starts with that definition problem, then works through one trade plan with numbers, then lists the conditions under which the pattern tends to mislead.
If you are not yet comfortable reading open, high, low, close, body and wick, start with our beginner’s guide to reading crypto candlestick charts. Everything below assumes you can.
The textbook rule and the crypto problem
The classic definition, as summarized on Thomas Bulkowski’s Pattern Site, is a two-candle pattern in a downtrend: a black (down) candle followed by a taller white (up) candle whose body engulfs the first body. Shadows are ignored. The second candle should open below the prior close and close above the prior open.
On a stock chart, “open below the prior close” happens naturally when the market gaps down at the morning open. Crypto never closes. On a liquid pair, each candle opens one trade after the previous candle closed, so the second candle’s open is usually equal to the first candle’s close, or a few dollars away in either direction. Apply the strict rule and you will reject most of the candles that look like engulfing patterns on your screen.
So you have to choose a rule and write it down. Three common versions:
| Version | Rule for candle 2 | Trade-off |
|---|---|---|
| Strict (textbook) | Open < prior close and close > prior open | Rare on 24/7 spot pairs; mostly appears on futures continuous charts or thin markets |
| Body-only, crypto-adapted | Open ≤ prior close and close > prior open | Matches what traders usually mean on crypto charts; more signals, more noise |
| Range-engulfing | Body covers the entire prior range, wicks included | Much rarer; demands a stronger candle |
None of these is “correct.” What matters is that you pick one before you look at results, and that you know which one any indicator or screener is using. If your scanner uses the strict rule and your eyes use the body-only rule, your backtest and your trading are about different patterns.
The timing of the candle boundary matters too. Daily candles on most crypto charts run from 00:00 to 00:00 UTC. A pattern that appears on UTC daily candles may not exist if your platform cuts days at a different hour. Pick a boundary and keep it.
Context filters before the candle counts
A two-candle pattern by itself carries very little information. Traders typically add context so the pattern is being asked a specific question: “has selling stalled here?” Here are filters you can define precisely:
- Prior decline. For example, the close five candles ago is above the first candle’s close, or price is below a 20-period moving average. Without a prior decline, there is nothing to reverse.
- Location. The engulfing low sits inside a support zone you marked before the pattern formed. Our support and resistance method gives a way to build and score those zones.
- Size. The engulfing body is at least 0.8 × ATR(14). A tiny engulfing candle after tiny candles is just noise.
- Volume. Candle 2 volume is above its 20-period average. See volume confirmation in crypto for the caveats about exchange-reported volume.
The thresholds above are starting points, not tested values. Keep them fixed while you collect results, then adjust once.
One trade plan, worked through
Illustrative ETH/USDT 4-hour candles, after a decline into a support zone at $2,440–$2,470:
| Candle | Open | High | Low | Close |
|---|---|---|---|---|
| 1 (red) | $2,520 | $2,528 | $2,430 | $2,462 |
| 2 (green) | $2,462 | $2,551 | $2,448 | $2,545 |
Does it qualify? Candle 2 opens at $2,462, exactly at the prior close, so the strict rule fails and the body-only rule passes. It closes at $2,545, above the prior open of $2,520. Body = $2,545 − $2,462 = $83. With ATR(14) at an illustrative $95, the body is about 0.87 × ATR, which passes a 0.8 × ATR size filter.
Stop. The pattern’s low is the lower of the two candles’ lows: $2,430. A stop exactly at the low is where many other traders put theirs, so add a small buffer: $2,430 − $8 = $2,422. If price trades below the low of the candle that “proved” buyers stepped in, the idea is invalid.
Target. The next resistance zone starts at $2,700.
Now compare two entry methods:
| A: Enter at candle 2 close | B: Limit at 50% of candle 2 body | |
|---|---|---|
| Entry | $2,545 | ($2,462 + $2,545) ÷ 2 = $2,503.50 |
| Risk per ETH | $2,545 − $2,422 = $123 | $2,503.50 − $2,422 = $81.50 |
| Reward per ETH | $2,700 − $2,545 = $155 | $2,700 − $2,503.50 = $196.50 |
| Reward-to-risk | 155 ÷ 123 ≈ 1.26 | 196.5 ÷ 81.5 ≈ 2.41 |
| Size at $100 risk (1% of $10,000) | 100 ÷ 123 ≈ 0.81 ETH | 100 ÷ 81.5 ≈ 1.23 ETH |
| Main weakness | Poor ratio; entry is at the top of a large candle | May never fill; the strongest moves often do not pull back |
This is the core decision with engulfing candles. Because the confirming candle is large by definition, entering at its close puts your stop far away and shrinks the reward-to-risk ratio. Entry A at 1.26 would need a fairly high hit rate just to break even after fees: at 1.26 : 1, you need to win more than 1 ÷ (1 + 1.26), about 44% of trades. The pullback entry improves the ratio but introduces missed trades, and missed winners are a real cost that rarely shows up in anyone’s notes. Our reward-to-risk guide explains that break-even calculation, and crypto position sizing covers the sizing formula.
If the target were at $2,600 instead, Entry A would offer $55 of reward for $123 of risk (about 0.45), and most rule sets would skip it entirely. Running these numbers before entering is the most useful thing you can do with this pattern.
Where the pattern misleads
- In the middle of a range. An engulfing candle between support and resistance is mostly two candles of random size. Without the location filter, expect noise.
- Inside a strong downtrend. One strong up-candle can be a short-covering bounce that fails at the next lower high. Check the higher-timeframe structure; see market structure explained.
- On news candles. A CPI release or exchange headline can produce a huge engulfing candle that reflects one event, not a shift in buying interest. Those candles often get fully retraced.
- On low timeframes. On 1-minute and 5-minute charts, engulfing shapes appear constantly. The rule stays the same, but the information in each instance is far smaller.
- Before the candle closes. A candle that “engulfs” with ten minutes left can close back inside the prior body. Decide on closed candles only.
- Exchange differences. Opens and closes differ slightly between venues. A pattern that qualifies on one exchange can fail the rule by a few dollars on another. Use the same data source for testing and trading.
How to test this yourself
- Write the rule down: which version (strict, body-only, range), which filters, which timeframe, which day boundary.
- Scroll back on one pair and one timeframe. For every qualifying candle 2, record entry (A and B), stop, nearest resistance, and what happened first: stop or target. Do not skip ugly examples.
- Record whether entry B would have filled before the stop or target was hit.
- Collect at least 30 instances before drawing any conclusion, and compare the result against a simple control, such as entering at the close of any green candle that closes inside the same support zones.
- Keep the log in a trading journal with a screenshot of each instance taken at the time the candle closed.
If the filtered engulfing set does not clearly beat the control, the pattern is not adding information to your support levels on that market and timeframe.
Financial disclaimer: This article is for educational purposes only and is not financial, investment, or trading advice. Trading involves substantial risk of loss. Example figures are illustrative.