Exchange Inflow Spikes: How to Read One Before You React

Illustrative chart for the article "Exchange Inflow Spikes: How to Read One Before You React"

A chart shows bitcoin exchange inflows jumping to two or three times their normal daily level, and the caption says “sell pressure incoming.” Sometimes that is roughly what happens. Often it is not, because an inflow total adds together very different kinds of deposits: a long-term holder sending coins to sell, a trader topping up … Read more
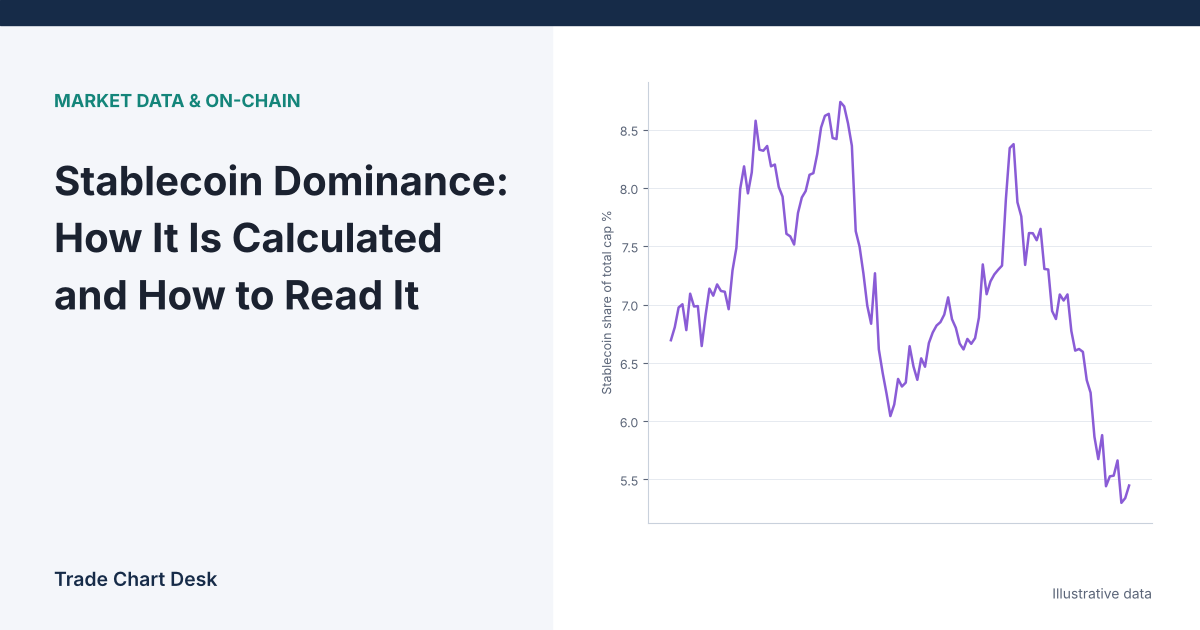
Stablecoin Dominance: How It Is Calculated and How to Read It

Illustrative chart for the article "Stablecoin Dominance: How It Is Calculated and How to Read It"

Here is a puzzle worth solving before you ever draw a trendline on a stablecoin dominance chart. Suppose not a single new stablecoin is minted and none are redeemed, yet stablecoin dominance rises from 10.0% to 12.2% in a week. Did traders “flee to stablecoins”? Not necessarily. Nothing about stablecoins changed at all. The rest … Read more

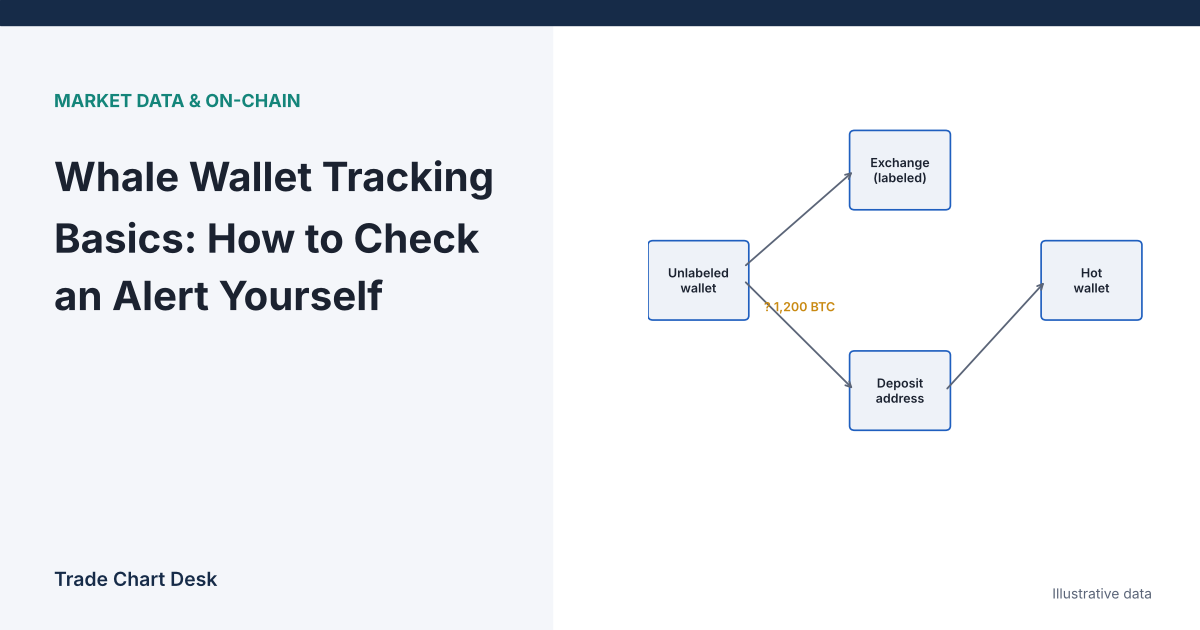
Whale Wallet Tracking Basics: How to Check an Alert Yourself

Illustrative chart for the article "Whale Wallet Tracking Basics: How to Check an Alert Yourself"

An alert pops up: “2,000 BTC transferred from unknown wallet to Exchange X.” Replies fill up with “dump incoming.” Before you react, it helps to know that an alert like this contains two very different kinds of information. The amount and the time are facts recorded on the blockchain. The words “unknown wallet” and “Exchange … Read more

Crypto Liquidation Heatmaps: What They Estimate and How to Read Them

Illustrative chart for the article "Crypto Liquidation Heatmaps: What They Estimate and How to Read Them"

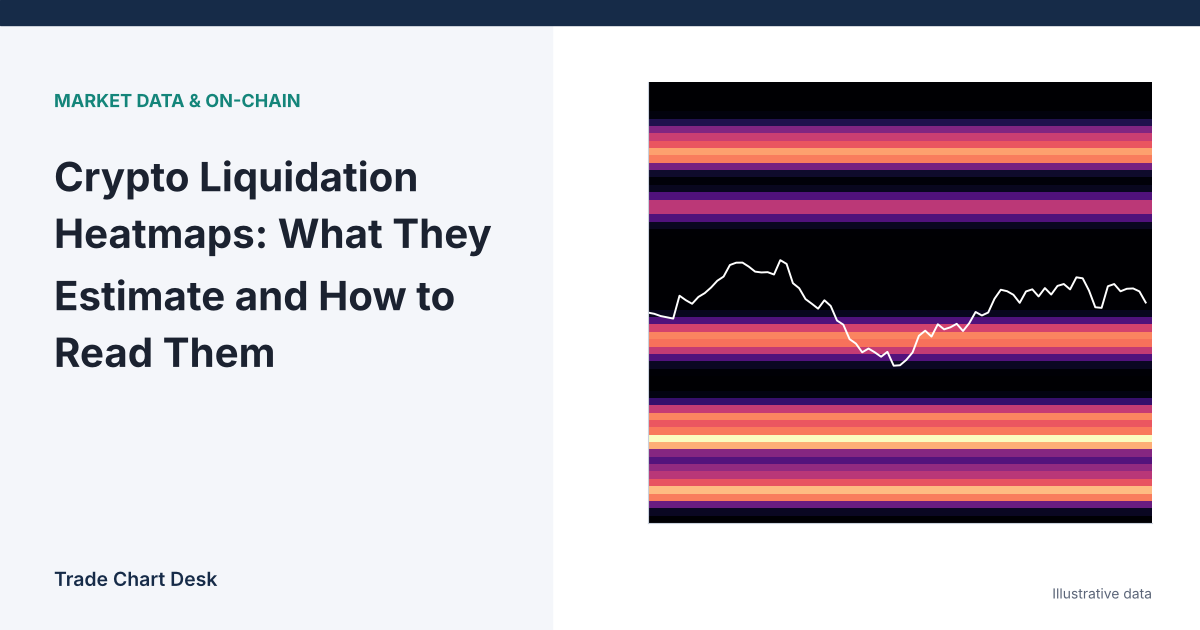
The most common misreading of a liquidation heatmap is treating the bright yellow band as a wall of real orders sitting at that price. It is not. No exchange publishes the liquidation prices of other traders’ positions. Every heatmap you see on a data site is a model’s guess, built from public data plus assumptions … Read more