
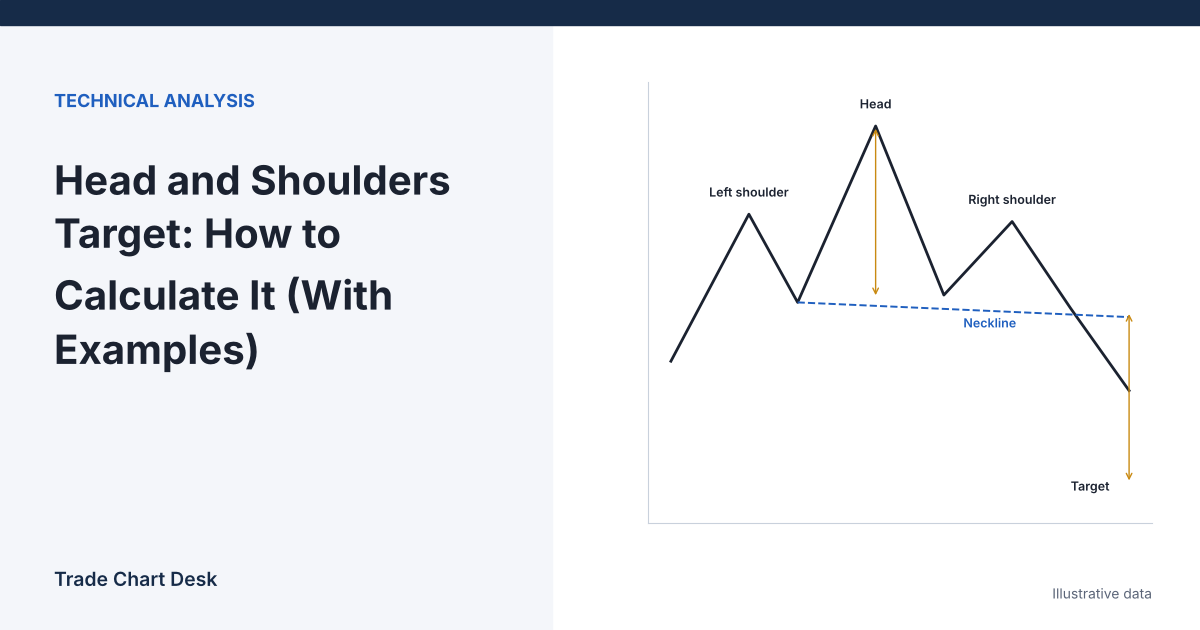
The measured-move target for a head and shoulders is usually explained in one sentence: take the distance from the head to the neckline and subtract it from the neckline. That sentence hides four decisions that can move your target by thousands of dollars on a Bitcoin chart. Which point on the neckline do you measure from? What if the neckline slopes? Do you subtract dollars or percent? And what do you do when the target sits below a major support level? This article starts with the simple calculation and then changes one assumption at a time so you can see how much each choice matters.
The pattern is built from swing highs and lows, which are themselves read from candles. If terms like swing low, wick and candle close are new, read how to read candlestick charts for crypto first.
The base case: horizontal neckline
A head and shoulders top is three swing highs with the middle one (the head) highest, and two troughs between them. The line connecting the two troughs is the neckline. Illustrative BTC daily chart:
| Point | Price |
|---|---|
| Left shoulder high | $65,800 |
| Left trough | $61,500 |
| Head high | $68,000 |
| Right trough | $61,500 |
| Right shoulder high | $64,400 |
With both troughs at $61,500, the neckline is flat.
- Height = head − neckline = $68,000 − $61,500 = $6,500.
- Target = neckline − height = $61,500 − $6,500 = $55,000.
For an inverse head and shoulders (a bottom), flip the signs. Neckline at $42,000 and head low at $36,000 gives a height of $6,000 and a target of $42,000 + $6,000 = $48,000.
The pattern is not complete until price closes below the neckline. Bulkowski’s head-and-shoulders top guide treats a close below the neckline as confirmation and advises waiting for it. Until then you have three highs, not a pattern, and many apparent right shoulders turn into the start of a new rally.
What changes if the neckline slopes?
Real troughs rarely line up. Suppose the left trough is $62,500 on day 0 and the right trough is $61,000 on day 20, with the head on day 10.
- Neckline slope = ($61,000 − $62,500) ÷ 20 days = −$75 per day.
- Neckline directly below the head (day 10) = $62,500 − 10 × $75 = $61,750.
- Height = $68,000 − $61,750 = $6,250. Measure vertically from the head to the neckline beneath it, not to either trough.
Now the starting point. If price closes below the extended neckline on day 26, the neckline there is $61,000 − 6 × $75 = $60,550. Three common choices produce three different targets:
| Measure from | Starting price | Target |
|---|---|---|
| Neckline at the breakout point (day 26) | $60,550 | $60,550 − $6,250 = $54,300 |
| Right trough (“armpit”), as Bulkowski suggests for down-sloping necklines | $61,000 | $61,000 − $6,250 = $54,750 |
| Neckline below the head | $61,750 | $61,750 − $6,250 = $55,500 |
The spread is $1,200. None of these is right in an absolute sense. The reason Bulkowski uses the right armpit for down-sloping necklines is practical: a steeply falling neckline can delay the breakout so long that the pattern has already played out. If the neckline slopes up instead, the breakout point is above the troughs and the targets converge more closely. Pick one convention, write it down, and use it every time.
What changes if you use percent instead of dollars?
The classic rule subtracts a dollar distance. On assets that move tens of percent, some traders prefer to project the same percentage move, which is what a logarithmic chart effectively does.
- Base case: height as a percent of the neckline = $6,500 ÷ $61,500 ≈ 10.57%.
- Percent-based target = $61,500 × ($61,500 ÷ $68,000) ≈ $55,621. (Equivalently, the head is about 10.57% above the neckline in log terms, and the target is the same log distance below.)
- Dollar-based target = $55,000.
On a pattern this size the gap is about $620. On a large pattern it grows quickly. A head at $73,000 above a $50,000 neckline gives a dollar target of $27,000 but a percent-based target of about $34,247. If you draw patterns on a log-scale chart and then measure in dollars (or the reverse), your target comes from a calculation you did not intend. TradingView’s scale setting is at the bottom-right of the chart; check which one is active before drawing.
What changes when the target sits beyond support?
Suppose a daily support zone you marked earlier sits at $56,500–$57,200. The calculated target is $55,000, below it. Price has to break that zone to reach the target, and support zones are where moves often pause. Many traders handle this by:
- Taking partial profit at the first obstacle ($57,200 here) and leaving the rest for the measured target.
- Using the obstacle as the full target if the reward-to-risk ratio still passes their minimum.
- Skipping the trade if the obstacle is so close to entry that the ratio falls below their minimum.
The measured move is a reference for “how big is this pattern,” not a promise. Rank interfering zones the same way you would rank any other support level: timeframe, reaction size and how recently they were tested.
Turning the target into a trade plan
Back to the base case. Price closes the day at $61,300, below the $61,500 neckline.
| Entry on the breakdown close | Entry on a retest of the neckline | |
|---|---|---|
| Entry | $61,300 | $61,400 (price rallies back toward the broken neckline and stalls) |
| Stop | Above the right shoulder: $64,400 + $300 = $64,700 | Above the retest high: an illustrative $62,300 |
| Risk per BTC | $3,400 | $900 |
| Reward to $55,000 | $6,300 | $6,400 |
| Reward-to-risk | ≈ 1.85 | ≈ 7.1 |
| Size at $100 risk | ≈ 0.0294 BTC | ≈ 0.111 BTC |
The retest version looks far better on paper, but it has two costs. Many breakdowns never retest, so you miss them. And a stop just above the retest high is tight, so ordinary noise can end the trade even if the pattern eventually works. Our breakout and retest guide covers how to define a retest precisely, and crypto position sizing explains the size formula used above.
Where the calculation misleads
- Drawing the pattern after the fact. Once price has fallen, any three highs look like a head and shoulders. Only count patterns you marked before the neckline broke.
- Wick versus close. A wick through the neckline is not a breakdown. On 24/7 crypto markets, your daily close also depends on the chart’s day boundary (most use 00:00 UTC), so the same move can close above the neckline on one platform and below it on another.
- The pattern breaks the other way. If price closes back above the right shoulder high, the pattern has failed. Traders who were short often become forced buyers, which can make failed patterns move fast.
- Small pattern, big expectations. Bulkowski notes that a small rise before the pattern tends to be followed by a small decline. A head and shoulders on a 15-minute chart describes a 15-minute-sized move.
- Inconsistent sources. Highs and lows differ between exchanges. A $300 difference in the head changes your height by $300. Use one data source.
Check your own targets
- For each pattern you find, record the date the neckline broke, the convention you used (breakout point, armpit, or below-head), dollar or percent, and the calculated target.
- Record the furthest price reached before price closed back above the right shoulder (the failure point).
- Express that as a fraction of your calculated height. After 20 or more patterns, look at the spread of results instead of a single average. If most patterns reach only half the height, your target is too ambitious for your market and timeframe.
Patterns with the same structure but continuation intent, like flags, use a different measurement; see bear flag vs bull flag patterns.
Financial disclaimer: This article is for educational purposes only and is not financial, investment, or trading advice. Trading involves substantial risk of loss. Example figures are illustrative.
1 thought on “Head and Shoulders Target: How to Calculate It (With Examples)”