
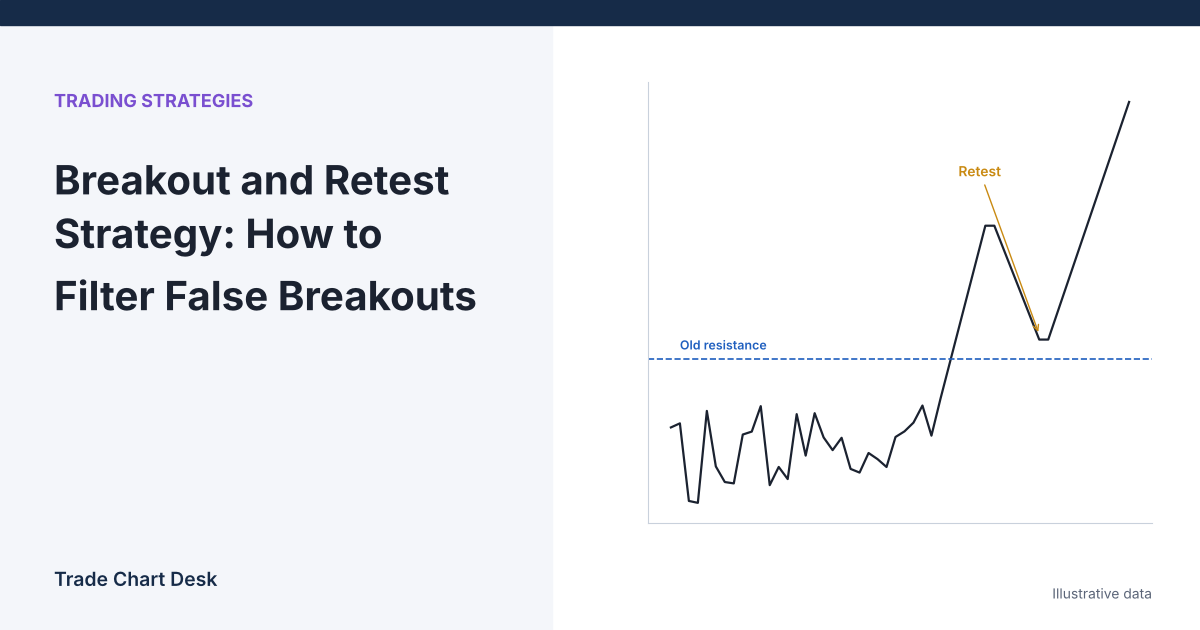
You watched Bitcoin grind under the same ceiling for a week. It finally pushes through, you buy the breakout candle, and two hours later price is back inside the range and your stop is gone. The usual advice is “wait for the retest.” That is good advice, but only if you can answer three questions before the chart moves: what counts as a real break, what counts as a retest, and what tells you the retest has failed. This guide turns each one into a number you can write down, then works through a full trade plan.
This guide covers discretionary breakouts: you draw the level yourself and wait for price to come back and hold it. If you would rather use fully mechanical entries, with no retest and no judgement about where the level sits, the Donchian channel breakout strategy covers that approach, including its sizing rules.
Why breakouts fail so often
A range high is visible to everyone. Short sellers park their stops just above it, and breakout traders park buy-stop entries in the same place. When price reaches that level, those orders fire together and create a burst of buying that can carry price through the level even if nobody new wants to own the asset higher up. Once those orders are filled, there may be no one left to buy, and price falls back.
This is not just trader folklore. A Federal Reserve Bank of New York study of currency dealers’ order books by Carol Osler found that stop-loss orders tended to sit just beyond round numbers, and that rates often trended strongly after crossing them. That research covered foreign exchange in the late 1990s, not crypto, but the mechanism is the same: a crowded level produces a fast move when it breaks, and fast moves powered by triggered orders are exactly the ones that can reverse.
The retest is a way of letting that first burst play out. If the level still matters after the trapped orders are cleared, price should come back to it and hold.
Three definitions to write down before you trade
Every number below is a choice you should test on your own market, not a standard. The point is to fix them in advance so you are not deciding what a “real” breakout looks like while watching one.
1. The level is a zone, not a line
Mark the range high from swing highs on a higher timeframe and give it a small width. Our support and resistance guide shows one way to build zones from swing points and ATR (Average True Range, the typical size of a bar’s movement).
2. A valid break needs a close, with a margin
Rule: the candle must close above the zone top by at least 0.25 × ATR. A wick through the level does not count. A close a few dollars above it does not count either, because that is within normal noise.
3. A retest has a floor
Rule: after the break, price may come back into the zone, but a close below zone top minus 0.5 × ATR means the breakout has failed. That gives you a retest band, a place where you want to see buyers return, with a hard line underneath it.
The procedure, worked with illustrative numbers
BTC/USDT on the 1-hour chart. All figures are illustrative.
- Range top (zone top): 64,200
- 1-hour ATR(14): 700
- Next resistance on the 4-hour chart: 66,300
- Account: $10,000, risking 1% ($100) per trade
Step A: Is the break valid?
Required close: 64,200 + 0.25 × 700 = 64,375. A candle closes at 64,650. That qualifies. A candle that wicked to 64,600 but closed at 64,280 would not.
Step B: Where is the retest band?
Failure line: 64,200 − 0.5 × 700 = 63,850. Any hourly close below 63,850 ends the setup. The retest band runs from 63,850 up to the zone top at 64,200.
Step C: What does a usable retest look like?
Over the next five candles, price drifts back down, prints a low of 63,980 inside the band, and then a candle closes at 64,420, back above the zone top. That is the trigger: price touched the old ceiling, held above the failure line, and closed back above the level.
Step D: Plan the trade
- Entry: 64,420 (close of the trigger candle)
- Stop: below the retest low with a small buffer: 63,980 − 0.25 × 700 = 63,805
- Risk per BTC: 64,420 − 63,805 = 615
- Reward per BTC to the next resistance: 66,300 − 64,420 = 1,880
- Reward-to-risk: 1,880 ÷ 615 ≈ 3.06
- Position size: $100 ÷ 615 ≈ 0.163 BTC
What the chaser’s trade looked like
Compare the trader who bought the breakout close at 64,650. Their logical stop is under the failure line: 63,850 − 0.25 × 700 = 63,675. Risk per BTC is 975, reward to 66,300 is 1,650, and reward-to-risk is about 1.69. Same idea, same level, same target, but roughly half the reward per unit of risk. That difference, not some magic in the retest, is the main argument for waiting. Our reward-to-risk guide explains why that ratio changes the win rate you need.
Reading a failed breakout before it costs you
Most false breakouts give at least one warning. These are the patterns worth naming in your notes:
| What you see | What it usually means | What the procedure does |
|---|---|---|
| Wick above the zone, close back inside | Stops and buy orders triggered, no follow-through | No valid break (Step A fails). No trade. |
| Close just above the zone, under the 0.25 × ATR margin | Break within normal noise | No valid break. Wait. |
| Valid close, then a close below the failure line | Breakout absorbed by sellers; often traps late buyers | Setup cancelled. Some traders now look for the opposite trade. |
| Valid close on unusually low volume | Few participants behind the move | Treat with suspicion. See the volume check below. |
| Retest holds, but trigger candle has a long upper wick | Sellers still active at the level | Optional: require a second close above the zone. |
Volume is the most common extra filter. If the breakout bar traded no more than an ordinary bar, there is little evidence that new participants arrived. Our guide to volume confirmation shows how to calculate relative volume so “high volume” becomes a number rather than an impression.
Where this method breaks down
- The retest never comes. Strong breakouts often run without looking back. Waiting means you will miss some of the best moves. That is a cost of the method, and your journal should count those missed trades rather than pretend they did not happen.
- The retest goes deeper than your band. In volatile conditions price can dip below the failure line, stop out the setup, and then rally. A band set at 0.5 × ATR may be too tight for some coins. Test 0.5, 0.75 and 1.0 on your market, then pick one and keep it.
- News overrides the level. A US CPI release or an exchange incident can move price through the whole band in one candle. Check the calendar before relying on a retest.
- Timeframe mismatch. A level drawn on the 4-hour chart and a retest judged on the 5-minute chart will give you many “retests” that do not mean anything. Judge the break and the retest on the same timeframe.
- Ranges that are not ranges. If the “range high” was touched only once, there is no crowd of orders around it and no reason to expect a retest to hold. Use levels with several clear tests.
Test it on your own chart
TradingView’s Bar Replay lets you hide future candles and step forward one bar at a time, which is the closest you can get to trading the setup live without risking money.
- Pick one market and one timeframe. Scroll back several months and start replay.
- Each time a marked range breaks, apply Steps A to C exactly as written. Do not adjust the numbers mid-test.
- Log each setup in four outcomes: no valid break, valid break with no retest (missed), retest failed, retest triggered. For triggered trades, record the result in R (multiples of the amount risked).
- After 30 or more valid breaks, compare the results of the retest entry against simply buying the breakout close with a stop under the failure line.
Our trading journal guide has a template you can adapt for these columns. If the retest entry does not beat the simple breakout entry on your data, after counting the missed trades, the extra patience is not paying for itself on that market.
Financial disclaimer: This article is for educational purposes only and is not financial, investment, or trading advice. Trading involves substantial risk of loss. Example figures are illustrative.
2 thoughts on “Breakout and Retest Strategy: How to Filter False Breakouts”