
Before a large Bitcoin options expiry, you will see headlines like “max pain sits at $100,000.” The number sounds like a forecast. It is not. It is the output of a simple calculation on open interest, and once you have done that calculation by hand you will know exactly what it measures, what it ignores, and why price often settles nowhere near it.
The calculation, worked by hand
Max pain is the settlement price at which all open options for one expiry would pay out the least in total intrinsic value to their holders. “Pain” here means option buyers lose the most (their options expire worth the least), which is the same as option sellers paying out the least.
The procedure:
- Pick one expiry date. Max pain is always per expiry, never across all expiries at once.
- List every strike with its call open interest and put open interest.
- Choose a candidate settlement price S (usually each listed strike in turn).
- For every strike K, compute call payout = max(S − K, 0) × call OI and put payout = max(K − S, 0) × put OI.
- Add all call and put payouts. That is the total payout at S.
- Repeat for every candidate S. The S with the smallest total is max pain.
Illustrative open interest for one BTC expiry
The figures below are made up for teaching. Assume each contract represents 1 BTC, which matches how Deribit sizes its BTC options.
| Strike | Call OI (BTC) | Put OI (BTC) |
|---|---|---|
| $90,000 | 200 | 700 |
| $95,000 | 350 | 1,100 |
| $100,000 | 900 | 1,000 |
| $105,000 | 1,200 | 300 |
| $110,000 | 800 | 150 |
Take S = $100,000 as one candidate:
- Calls in the money: $90k strike pays $10,000 × 200 = $2,000,000; $95k strike pays $5,000 × 350 = $1,750,000. Call total: $3,750,000.
- Puts in the money: $105k strike pays $5,000 × 300 = $1,500,000; $110k strike pays $10,000 × 150 = $1,500,000. Put total: $3,000,000.
- Total payout at $100,000: $6,750,000.
Doing the same for every strike gives:
| Settlement price S | Call payout | Put payout | Total payout |
|---|---|---|---|
| $90,000 | $0 | $23,000,000 | $23,000,000 |
| $95,000 | $1,000,000 | $10,250,000 | $11,250,000 |
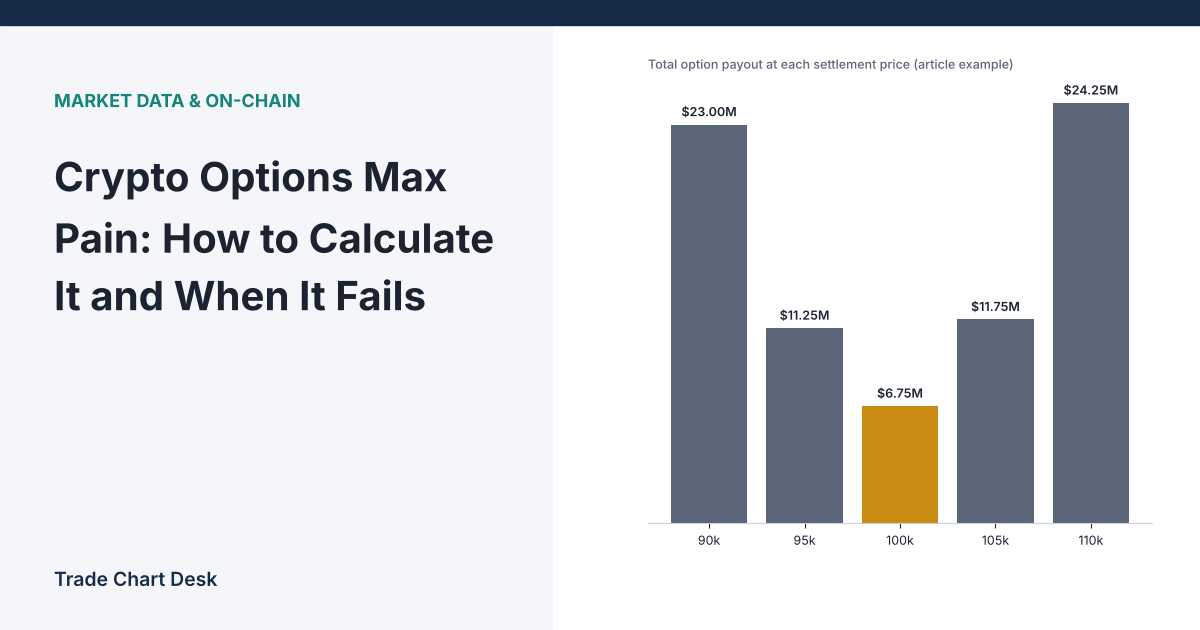
| $100,000 | $3,750,000 | $3,000,000 | $6,750,000 |
| $105,000 | $11,000,000 | $750,000 | $11,750,000 |
| $110,000 | $24,250,000 | $0 | $24,250,000 |
Max pain for this expiry is $100,000. Notice the shape: total payout is a valley, steep on both sides. That shape is all max pain describes.
What changes if the open interest changes
The single most useful thing to learn from the hand calculation is how fragile the answer is.
Scenario: a new block of puts at one strike
Suppose someone opens 1,500 new puts at the $105,000 strike (put OI there rises from 300 to 1,800). Nothing else changes. Recalculating:
- At $100,000, the $105k puts now pay $5,000 × 1,800 = $9,000,000 instead of $1,500,000, so the total rises to $14,250,000.
- At $105,000, those puts are at the money and pay nothing, so the total stays at $11,750,000.
Max pain jumps from $100,000 to $105,000 because of one trade. A single large position, perhaps a hedge from a fund that has no view on where price settles, can move the headline number by a full strike. This is why max pain figures published on Monday can be meaningless by Thursday.
Scenario: settlement lands between strikes
Real settlement is a continuous price, not a strike. With the original table, a settlement at $102,500 gives a total payout of $9,250,000. That is higher than at $100,000 but lower than at $105,000. Max pain tools only test listed strikes, so the “answer” is really a coarse grid reading, not a precise level.
How Deribit expiries actually settle
Many published BTC and ETH max pain figures are built from Deribit’s options chain, so its rules are worth knowing. Check which venue any chart you use is based on. Per Deribit’s expiry schedule and settlement documentation (checked October 2026):
- Expiry time: 08:00 UTC. That is 4:00 a.m. in New York during daylight saving time and 3:00 a.m. in winter.
- Schedule: daily expiries every calendar day, weeklies every Friday, monthlies on the last Friday of the month, and quarterlies on the last Friday of March, June, September and December. The quarterly and month-end expiries are the large ones that make headlines.
- Settlement price: a 30-minute time-weighted average of the Deribit index from 07:30 to 08:00 UTC, not the price at a single instant.
- Style: European, automatically exercised if in the money, cash-settled (BTC options settle in BTC). Since 1 August 2026, in-the-money inverse options pass briefly through a futures position at the strike before cash settlement. Deribit states the payout is economically the same as before; it mainly affects how the entries appear in account history.
The 30-minute average matters for the max pain story. A brief spike at 07:59 has little effect on the settlement value. To “pin” a settlement, price would need to sit near a level for most of that half hour, across the exchanges that feed the index.
Why price might drift toward max pain, and why it often does not
The argument for max pain is usually about hedging. Market makers who sold options hedge with futures or spot. As expiry approaches, the size of those hedges changes quickly when price is near a heavily traded strike, and the resulting buying and selling can, in some conditions, dampen movement around that strike. That is a plausible mechanism, not a proven rule, and it depends on details the max pain number does not contain:
- Who is short the options. Max pain assumes holders lose and writers win. It does not know whether market makers are net long or net short at each strike. If dealers are net long options, their hedging can amplify moves instead of damping them.
- Premiums. The calculation uses intrinsic value only. A trader who sold a put for a large premium may be fine even if it settles in the money.
- Other venues. Open interest on CME, OKX, Binance and on-chain venues is not in a single-exchange max pain chart.
- Bigger flows. Spot ETF flows, macro data and liquidation cascades in perpetual futures can overwhelm any options-related hedging. Our guide to funding rates covers one of those competing forces.
Common mistakes
- Reading max pain as a price target. It is a description of today’s open interest, recalculated as positions change.
- Mixing expiries. A daily expiry with small open interest has its own max pain; it says nothing about the quarterly.
- Using it days in advance. As the scenario above shows, one block trade can move it a full strike.
- Ignoring the time zone. The event is 08:00 UTC, not the U.S. close.
- Trading the expiry with leverage. Volatility around large expiries can trigger stops before any “pin” appears. Our article on stop-loss hunting explains how stop clusters behave in fast moves.
Check it yourself
You do not need a paid tool to verify any max pain figure you see online:
- Open the options chain for one expiry on the exchange (Deribit shows open interest per strike).
- Copy strike, call OI and put OI into a spreadsheet, one row per strike.
- Put candidate prices across the top row and, in each cell, compute
MAX(S−K,0)*CallOI + MAX(K−S,0)*PutOI. Sum each column. - The column with the smallest sum is max pain. Compare it with the figure the website published.
- For a journal test, record max pain at fixed times (for example 72 hours and 24 hours before expiry), then record the actual settlement price from the exchange. After a few dozen expiries you will have your own view of how close they tend to be, instead of relying on anecdotes. Our trading journal guide shows how to keep that record consistently.
Open interest itself is worth watching alongside this. A sudden jump in OI at one strike is often more informative than the max pain number derived from it; see our explainer on open interest spikes.
Financial disclaimer: This article is for educational purposes only and is not financial, investment, or trading advice. Trading involves substantial risk of loss. Example figures are illustrative.