
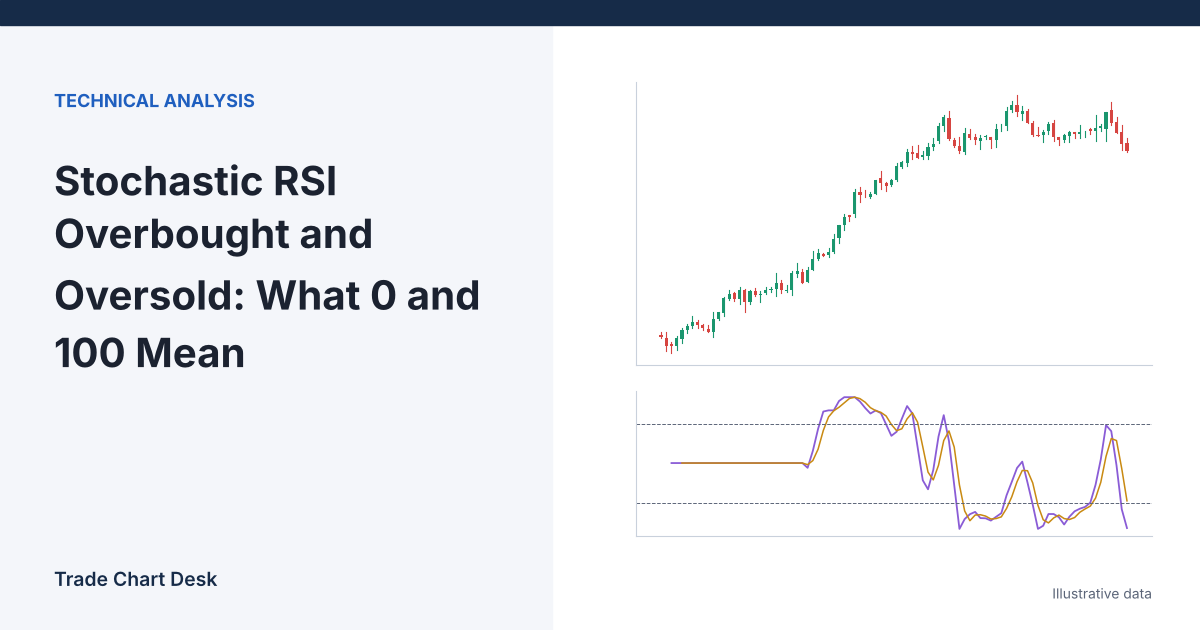
Here is a situation that confuses a lot of new traders. RSI reads 49.5, almost exactly neutral. On the same bar, Stochastic RSI reads 0, the most “oversold” value it can print. Both indicators are built from the same closes. How can one say “nothing special” while the other says “extreme”?
The answer explains almost everything about how to read Stoch RSI, and why “above 80 means sell, below 20 means buy” is the wrong way to use it. This guide is organised around the misconceptions that cause the most bad trades, each followed by what the math actually says.
The formula in one line
Stochastic RSI was introduced by Tushar Chande and Stanley Kroll in their 1994 book The New Technical Trader. It applies the stochastic formula to RSI values instead of prices:
StochRSI = (RSI − lowest RSI in n bars) ÷ (highest RSI in n bars − lowest RSI in n bars)
StockCharts ChartSchool plots the raw result on a 0 to 1 scale with 0.80 and 0.20 as the usual overbought and oversold lines. TradingView’s built-in Stoch RSI uses an RSI length of 14 and a stochastic length of 14, multiplies by 100, and then smooths it: %K is a 3-period SMA of the raw value and %D is a 3-period SMA of %K (inputs K = 3, D = 3, source = close). Same idea, different scale and smoothing. If your numbers do not match someone else’s screenshot, check these four settings first.
Misconception 1: “0 means RSI is oversold”
Reality: 0 means RSI is at the lowest point of its own last 14 bars. That is all.
Take these illustrative 14-period RSI readings, oldest first:
60, 63, 66, 64, 61, 58, 56, 55, 54, 53, 52, 51, 50, 49.5
The last value, 49.5, is the lowest of the 14. So StochRSI = (49.5 − 49.5) ÷ (66 − 49.5) = 0. RSI has merely drifted from mildly bullish to neutral, and Stoch RSI is pinned at the floor. In a strong uptrend that cools off sideways, this happens constantly. It is a statement about the recent RSI range, not about price being cheap.
Misconception 2: “Crossing back above 20 is the buy signal”
Reality: because of the rolling window, Stoch RSI can rise sharply even while RSI barely moves. Continue the example with the next five RSI readings:
| Bar | RSI | 14-bar RSI high / low | Raw StochRSI (×100) | %K (3-SMA) | %D (3-SMA of %K) |
|---|---|---|---|---|---|
| 14 | 49.5 | 66 / 49.5 | 0.0 | ||
| 15 | 50.0 | 66 / 49.5 | 3.0 | ||
| 16 | 51.5 | 66 / 49.5 | 12.1 | 5.0 | |
| 17 | 53.0 | 64 / 49.5 | 24.1 | 13.1 | |
| 18 | 55.0 | 61 / 49.5 | 47.8 | 28.0 | 15.4 |
| 19 | 57.0 | 58 / 49.5 | 88.2 | 53.4 | 31.5 |
Look at bars 18 and 19. RSI rose from 55 to 57, two points. Raw StochRSI jumped from 47.8 to 88.2. Much of that jump came from the window, not from RSI: between bars 16 and 19 the old high readings (66, 64, 61) dropped out of the 14-bar lookback, shrinking the RSI range from 16.5 points to 8.5. The indicator went from “oversold” to “overbought” in five bars while RSI moved from 49.5 to 57, never leaving neutral territory.
The smoothed %K lags behind the raw value, and %D lags further. A %K/%D cross above 20 on bar 18 would have come after most of the raw move had already happened. If you only watch the smoothed lines, you will not notice the range-shrink effect that produced it.
Misconception 3: “Overbought means sell”
Reality: in a trend, Stoch RSI can sit above 80 for long stretches, dip briefly and return. ChartSchool calls it an indicator of an indicator, two steps removed from price, and notes that it produces far more overbought and oversold readings and whipsaws than RSI. Its suggestion is to read the extremes in the context of the medium-term trend: watch for oversold readings in uptrends and overbought readings in downtrends.
That reframes Stoch RSI as a pullback timer inside a trend you have already identified, not as a reversal signal on its own. Our guide to market structure covers one way to define that trend from swing highs and lows.
Misconception 4: “A tiny RSI range is a calm, reliable signal”
Reality: the narrower the RSI range, the noisier Stoch RSI becomes. If RSI has stayed between 51 and 53 for 14 bars, an RSI of 52 gives StochRSI = (52 − 51) ÷ (53 − 51) = 0.5, and RSI touching 53 sends it straight to 1.0 (100). A one-point RSI wiggle swings the oscillator across half of its scale. During quiet, ranging markets, readings at 0 and 100 are almost meaningless. A practical filter is to check the raw RSI range before trusting an extreme: if the 14-bar RSI high minus low is only a few points, ignore the Stoch RSI reading.
A decision checklist that uses Stoch RSI properly
This is a template to test, not a recommendation:
- Trend first. On a higher timeframe, is price making higher highs and higher lows (or the reverse)? If there is no clear trend, skip Stoch RSI signals entirely.
- Look only for pullback extremes in the trend’s direction. In an uptrend, wait for %K below 20. Ignore readings above 80.
- Check the RSI range. Require the 14-bar RSI high minus low to be at least, say, 10 points, so the reading reflects a real move rather than a tiny wiggle.
- Need a price trigger. Stoch RSI turning up is not enough. Require price to do something, such as closing above the previous candle’s high or reclaiming a level. Our support and resistance guide covers how to choose the level.
- Stop and size from price, not from the oscillator. Place the stop below the pullback low and size the position so that stop costs a fixed percentage of the account. For example, with an entry at 2,530, a pullback low at 2,300 and $100 of risk, size = 100 ÷ 230 ≈ 0.435 units. The position sizing guide explains the formula.
When this approach still fails
- Trend changes. The checklist assumes the trend continues. When it ends, the “oversold pullback” is the start of a decline, and the price trigger may still fire once before failing. The stop exists for this case.
- Low timeframes. On 1- to 5-minute crypto charts, Stoch RSI crosses so often that fees and slippage can absorb any edge.
- Stacking similar indicators. Adding plain RSI, the regular Stochastic, or MFI as “confirmation” mostly repeats the same information from the same closes.
- Repainting expectations. On the live candle, %K and %D move with every tick. Act only on closed bars.
Check it yourself in ten minutes
- Add both RSI (14) and Stoch RSI (3, 3, 14, 14) to the same TradingView chart.
- Find five occasions where Stoch RSI hit 0 or 100. For each, note the RSI value at the time and the RSI 14-bar high and low (hover the RSI pane to read them).
- Count how many of those extremes happened with RSI between 40 and 60. That number tells you how often “extreme” Stoch RSI meant a neutral RSI on your market and timeframe.
- For a quick sanity check of the formula, copy 14 RSI values into a spreadsheet and compute
=(last − MIN(range)) / (MAX(range) − MIN(range)) * 100. It should match the raw value, before the %K smoothing.
Financial disclaimer: This article is for educational purposes only and is not financial, investment, or trading advice. Trading involves substantial risk of loss. Example figures are illustrative.