
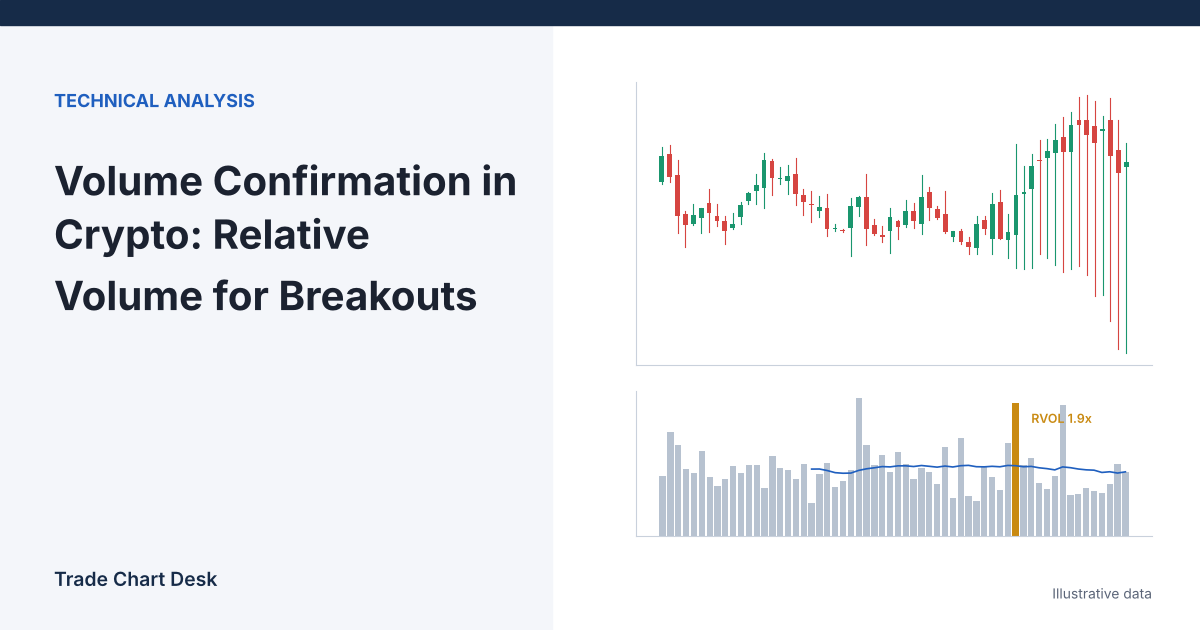
“Breakouts need high volume” is one of the first rules traders learn, and one of the least useful as written. High compared with what? Measured on which exchange? At what point in the candle? A breakout bar that shows 1,650 BTC of volume tells you nothing until you know that an ordinary bar on that chart trades about 900. This guide is about turning volume into a ratio you can calculate, the three corrections that ratio needs in crypto, and the cases where volume tells you nothing at all.
Volume here is a filter, not a strategy on its own. It can sit on top of a discretionary entry such as the breakout and retest method or a mechanical one such as the Donchian channel breakout.
The basic number: relative volume
Relative volume (RVOL) = volume of the bar you are judging ÷ average volume of comparable past bars
An RVOL of 1.0 means an ordinary amount of trading. An RVOL of 2.0 means twice the usual. That single ratio replaces “high volume” with something you can put a threshold on and test.
Worked example with illustrative numbers
Here are the volumes, in BTC, of the 20 one-hour candles before a breakout on one exchange’s BTC/USDT chart:
820 · 760 · 910 · 1,050 · 690 · 880 · 940 · 1,010 · 730 · 860 · 990 · 1,120 · 800 · 770 · 950 · 1,080 · 900 · 840 · 1,300 · 860
- Sum = 18,260, so the 20-bar average = 913 BTC
- Median = 890 BTC
Three possible breakout candles:
| Breakout bar volume | RVOL vs. average | RVOL vs. median |
|---|---|---|
| 1,150 | 1.26 | 1.29 |
| 1,650 | 1.81 | 1.85 |
| 2,900 | 3.18 | 3.26 |
The first bar is barely above normal. The second is clearly elevated. The third is unusual enough that you should ask why before celebrating, which comes up again below. Many traders use something around 1.5 as a minimum to call a breakout “confirmed”, but that is a convention, not a tested threshold. You should choose your own and test it.
Why mention the median? A single huge bar in the lookback, such as a liquidation cascade, inflates the average and makes every later bar look quiet. The median is not affected by one outlier. If the two figures differ a lot, your lookback contains a spike and the average is misleading.
Correction 1: compare like with like across the day
Crypto trades 24/7, but trading activity is not spread evenly. Volume is often noticeably different during the overlap of European and US trading hours than in the quiet hours of the Asian night or on weekends. A breakout at a busy hour compared with a 20-bar average that includes eight quiet overnight bars will look stronger than it is.
The fix is to compare against the same hour on previous days. Suppose the breakout happens in the 15:00 UTC candle with 2,900 BTC, and the 15:00 candle on each of the last five days traded 1,400, 1,250, 1,600, 1,350 and 1,500 BTC. The same-hour average is 1,420, so time-of-day RVOL is 2,900 ÷ 1,420 ≈ 2.04, much less dramatic than the 3.18 from the simple 20-bar comparison. Still elevated, but no longer extraordinary.
TradingView’s built-in Relative Volume at Time indicator does this calculation for you: it compares the current bar with the bars at the same point in each of the previous N periods (for example, each previous day). By default it uses cumulative volume since the start of each period, so read the help page and decide whether you want cumulative or single-bar mode.
Correction 2: do not judge a candle that has not closed
Forty minutes into a one-hour candle, volume reads 1,100. It is tempting to project: 1,100 × 60 ÷ 40 = 1,650, an RVOL of about 1.81. But volume around a breakout is front-loaded. Triggered stops and breakout entries fire together in the first minutes, and the rest of the hour may be much quieter. The projection assumes a steady pace that rarely exists. Either wait for the close, or use a lower timeframe where the candle closes sooner and judge it there.
Correction 3: know whose volume you are looking at
Most crypto charts show the volume of one trading pair on one exchange. That has two consequences.
- A move on one venue may not be a market move. A spike in volume on a single exchange can come from one large order or a local event. Check the same pair on one or two other major exchanges before trusting it.
- Some reported volume is not genuine. In a 2019 presentation to the SEC, the asset manager Bitwise argued that about 95% of reported bitcoin spot volume across the 81 exchanges it reviewed was fake or non-economic, with genuine activity concentrated on about ten exchanges. The industry has changed since then, but the lesson stands: use volume from large, well-known venues, and be sceptical of volume on exchanges you cannot vouch for.
Perpetual futures volume is often several times spot volume and includes leveraged positioning and liquidations. A futures-volume spike without a matching spot-volume rise can mean the move is mostly leverage, which you can check against open interest.
Reading the breakout with volume: a decision table
Volume is never a signal on its own. It is evidence about the price event you already identified. Pair it with the close.
| Price behaviour | RVOL (time-of-day) | How to read it |
|---|---|---|
| Closes clearly beyond the level | 1.5 or higher | Participation supports the break. Still plan for a retest. |
| Closes clearly beyond the level | Under about 1.2 | Price moved without many participants. Higher fake-out risk; consider waiting for a retest. |
| Wicks beyond, closes back inside | High | Lots of orders filled and price still failed. Often absorption by the other side; a classic fake-out. |
| Wicks beyond, closes back inside | Low | Nothing happened. Ignore it. |
| Closes beyond, very high RVOL (over 3) with a long wick against the move | Very high | Possible exhaustion or liquidation spike. Check for news before acting. |
The third row is the one most traders get wrong. High volume on a failed break is not confirmation; it shows that a large amount of buying met an even larger amount of selling. Our breakout and retest guide covers what to do after the break, and the order book absorption guide shows the same effect from the order flow side.
Follow-through matters as much as the breakout bar
One more check: what happens on the bars after the break. If the next two or three candles also trade above normal volume while holding above the level, more participants are joining. If volume collapses immediately and price drifts back toward the level, the breakout was a single burst. A simple rule to test: the average RVOL of the two bars after the breakout should stay above 1.0.
When volume tells you little
- Scheduled news. Around a CPI release or an FOMC decision, volume rises in both directions regardless of whether a technical breakout is real. Elevated RVOL during news is expected, not confirming.
- Thin altcoins. On low-liquidity pairs, a handful of trades can double RVOL. Ratios are only meaningful when normal volume is large enough to be stable.
- Exchange listing and delisting events. Volume patterns change abruptly and old averages stop being comparable.
- Volume indicators that look like confirmation. Cumulative indicators such as On-Balance Volume can be dominated by a single heavy bar. Check the raw bar volumes behind them.
Test your threshold
- Export hourly candles for one pair on a major exchange. Binance’s public kline data, for example, includes base-asset volume, quote volume, number of trades and taker-buy volume for every candle.
- Mark at least 30 breakouts of well-defined ranges using a fixed rule for what counts as a break (for example, a close beyond the range by 0.25 × ATR).
- For each, record time-of-day RVOL of the breakout bar and whether price closed back inside the range within the next five bars.
- Split the results into RVOL bands: under 1.2, 1.2 to 1.5, 1.5 to 2.5, over 2.5. Compare how often each band failed.
If failure rates do not differ meaningfully between bands on your market, volume is not helping you filter breakouts there, and you should stop treating it as a requirement. If they do, you now have a threshold based on your own data rather than a rule of thumb.
Financial disclaimer: This article is for educational purposes only and is not financial, investment, or trading advice. Trading involves substantial risk of loss. Example figures are illustrative.