
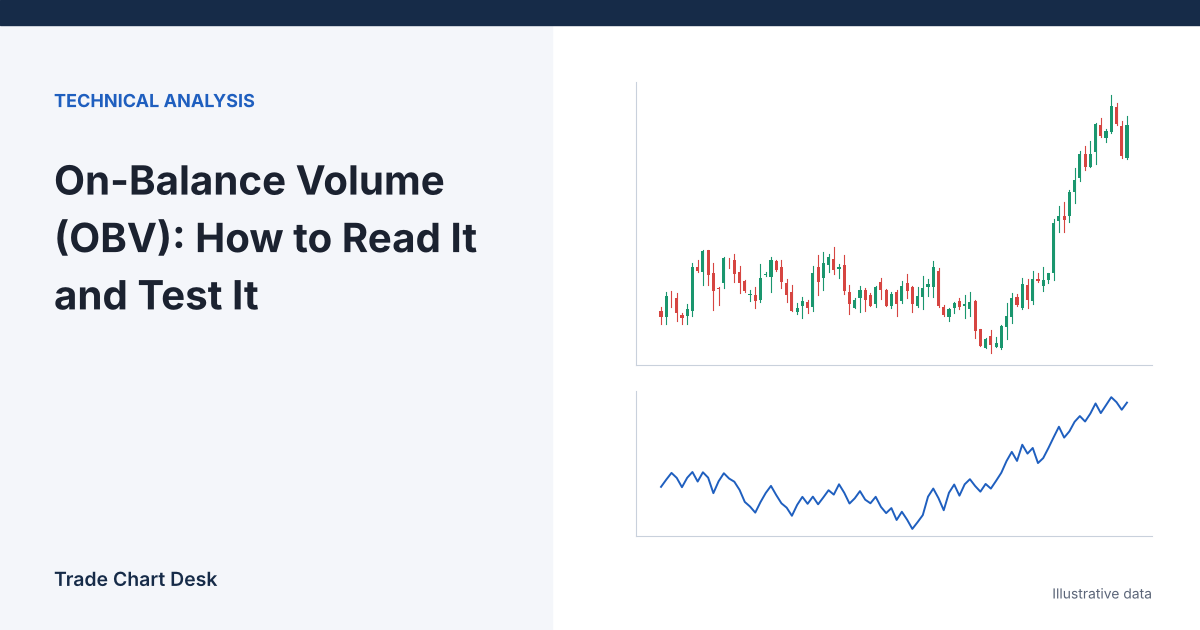
Most people who add On-Balance Volume to a chart look at the number on the right edge, see something like “−184,302”, and wonder whether that is good or bad. It is neither. The absolute value of OBV depends entirely on where your chart’s data history starts, so two traders looking at the same coin can see completely different numbers. What carries information is the direction and shape of the line compared with price. This guide shows the arithmetic behind that line, a worked example where one bar distorts it, and a way to turn “OBV divergence” from a vague impression into something you can log and check.
The calculation, in three rules
OBV was introduced by Joe Granville in his 1963 book Granville’s New Key to Stock Market Profits. It is a running total that only ever does one of three things on each new bar:
- If the close is higher than the previous close: OBV = previous OBV + this bar’s volume.
- If the close is lower than the previous close: OBV = previous OBV − this bar’s volume.
- If the close is equal to the previous close: OBV stays unchanged.
That is the whole formula, and it matches the definition in TradingView’s On Balance Volume help page. There are no lookback lengths and no default settings to tune. TradingView’s built-in version adds optional smoothing (a moving average of OBV), but the raw line has no parameters.
A worked example: watch the sixth bar
Here are seven illustrative 4-hour bars for a BTC pair. Volume is in BTC. OBV starts at zero on the first bar.
| Bar | Close | Change vs. prior close | Volume | OBV |
|---|---|---|---|---|
| 1 | 60,000 | (start) | n/a | 0 |
| 2 | 60,600 | +600 | 1,500 | 1,500 |
| 3 | 60,300 | −300 | 900 | 600 |
| 4 | 60,300 | 0 | 1,100 | 600 |
| 5 | 61,200 | +900 | 2,000 | 2,600 |
| 6 | 61,150 | −50 | 5,200 | −2,600 |
| 7 | 61,900 | +750 | 800 | −1,800 |
Look at what happened. Over these bars, price rose from 60,000 to 61,900 and closed at the highest close of the sample. OBV, meanwhile, finished below where it started. A trader who glanced at the chart would call this a bearish divergence: price making higher highs, OBV falling.
But the entire “divergence” comes from bar 6, which closed just $50 lower on very heavy volume. OBV assigns all 5,200 BTC of that bar to the sell side, even though the bar may have spent most of its time trading higher, and even though a $50 change on a $61,000 asset is about 0.08%, which is noise. Bar 4, with 1,100 BTC traded, contributed nothing at all because its close happened to match the previous one exactly.
This is the single most important thing to understand about OBV: it treats each bar’s volume as all-buy or all-sell based on one comparison of two closing prices. Small closing differences on high-volume bars can dominate the line.
What OBV can and cannot tell you
| Question | Can OBV answer it? |
|---|---|
| Has more volume traded on up-closing bars than on down-closing bars over this stretch? | Yes. That is literally what the slope measures. |
| Did buyers or sellers initiate the trades? | No. Every trade has a buyer and a seller. OBV only knows the close-to-close direction. |
| Is the current OBV value high or low? | Not in absolute terms. Compare it with its own recent swings instead. |
| Is volume across all exchanges confirming the move? | Only if your data feed aggregates exchanges. Most charts use one venue’s volume. |
| Will price follow OBV? | No indicator can promise that. The idea that volume leads price is a hypothesis to test, not a law. |
Three ways traders read the line
1. Confirmation of a trend
In a healthy uptrend, you would expect OBV to make higher highs alongside price, because up-closing bars are carrying more volume than down-closing bars. When price breaks a range and OBV also breaks above its own range high, the move has volume behind it on that venue. Our guide to volume confirmation on breakouts covers that use in more detail.
2. Divergence
A bearish divergence is price making a higher swing high while OBV makes a lower swing high. A bullish divergence is the reverse at swing lows. The worked example above shows why you should check the bars that created the divergence before trusting it.
3. OBV breakouts
Some traders draw trendlines or ranges on the OBV line itself and watch for it to break out before price does. This is the most subjective use, because where you draw the line on OBV is a judgment call.
Turning “divergence” into a rule you can log
“OBV is diverging” means different things to different people, which is why it is hard to evaluate. Here is one way to make it specific. The thresholds are examples to test, not recommended values.
- Define swings mechanically. For example, a swing high is a bar whose high is the highest of the 5 bars before and the 5 bars after it. Apply the same rule to OBV.
- Define the divergence. Price swing high B is above swing high A, and OBV at B is below OBV at A, with A and B no more than 30 bars apart.
- Add a materiality check. Find the largest single-bar OBV change between A and B. If one bar accounts for more than half of the OBV drop, flag the signal as “single-bar” like bar 6 above.
- Define what you are testing. For example: did price close below swing low between A and B within the next 20 bars? Write that down before you look.
- Log every instance, including those where nothing happened. Our trading journal guide has a template you can adapt.
Note that step 1 means a swing is only confirmed 5 bars after it happens. Any divergence rule built on swings arrives late. If you test on a chart where you can see both sides of the swing, you will overestimate how early the signal was available.
How to check it yourself
- Reproduce the line. Export 50 bars of OHLCV data (TradingView has a “Download chart data” option in the chart menu, though availability can depend on your plan; most exchanges also offer candle downloads or an API). Build the three rules in a spreadsheet:
=IF(C3>C2, F2+D3, IF(C3<C2, F2-D3, F2)), where C is close, D is volume and F is OBV. Your slope should match the chart’s, even though the absolute values will differ because your starting point is different. - Compare venues. Put OBV on the same pair from two exchanges, for example BTCUSDT on one spot exchange and BTCUSD on another. If the lines tell different stories, the “signal” belongs to one venue’s order flow, not the market.
- Change the timeframe. A divergence on 15-minute bars may not exist on 4-hour bars, because the close-to-close comparisons change completely.
Where OBV fails
- Single-venue volume. Crypto trades on many exchanges at once. If your chart shows one exchange’s volume, OBV reflects that exchange only. Wash trading and zero-fee promotions on some venues have historically inflated reported volume, which makes volume-based indicators less reliable there.
- Doji-like closes on big bars. As shown above, a tiny close-to-close change can swing OBV by the whole bar’s volume.
- News spikes. A liquidation cascade can print several bars of enormous volume in one direction. OBV will lurch and may take weeks of normal trading to “recover” visually, even though the event is over.
- Long-lived divergences. In a strong trend, OBV can diverge from price repeatedly while price keeps going. A divergence is a reason to look more closely, not a timing signal.
- Starting-point confusion. Because OBV is cumulative, scrolling or changing the loaded history can shift the whole line up or down. Read swings and slopes, not levels.
OBV compared with its relatives
OBV’s all-or-nothing rule is its main weakness, and other volume indicators try to fix it. Chaikin Money Flow weights each bar’s volume by where the close sits within the bar’s high-low range, so a bar closing near its middle contributes little. The Money Flow Index combines typical price and volume in an RSI-style oscillator with a fixed lookback, so it stays bounded and does not depend on where your history starts. If the bar-6 problem bothers you, compare OBV with Chaikin Money Flow or the Money Flow Index on the same chart and see where they disagree.
Financial disclaimer: This article is for educational purposes only and is not financial, investment, or trading advice. Trading involves substantial risk of loss. Example figures are illustrative.
1 thought on “On-Balance Volume (OBV): How to Read It and Test It”