
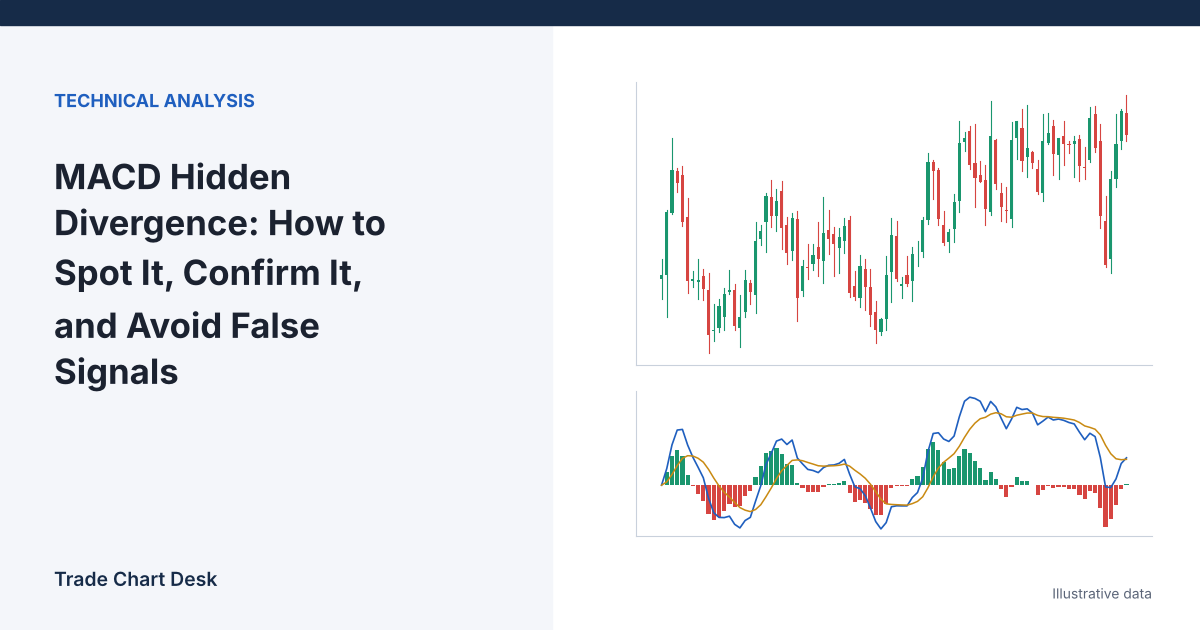
Hidden divergence is a way of asking a specific question during a trend: “Price pulled back, but did the pullback damage the trend’s structure?” When price holds a higher low while momentum dips to a lower low, some traders read that as a pause inside an intact uptrend rather than a reversal. This guide explains exactly what is being compared, how to measure it consistently, why it is easy to see in hindsight and harder in real time, and how to turn it into a rule you can actually test.
What MACD is made of
MACD has three parts, and mixing them up is the most common source of bad divergence calls:
- MACD line = 12-period EMA − 26-period EMA (default settings).
- Signal line = 9-period EMA of the MACD line.
- Histogram = MACD line − signal line.
The MACD line measures how far the fast average is from the slow average. The histogram measures how fast that distance is changing. Because they are different series, they often make their lows and highs on different bars. A divergence drawn on the histogram can disappear when you look at the MACD line, and vice versa. Pick one and stick with it. TradingView’s MACD reference documents the standard calculation and default inputs.
Regular vs. hidden divergence
| Type | Price | MACD (same series) | Usual interpretation |
|---|---|---|---|
| Regular bullish | Lower low | Higher low | Selling momentum fading; possible reversal up |
| Regular bearish | Higher high | Lower high | Buying momentum fading; possible reversal down |
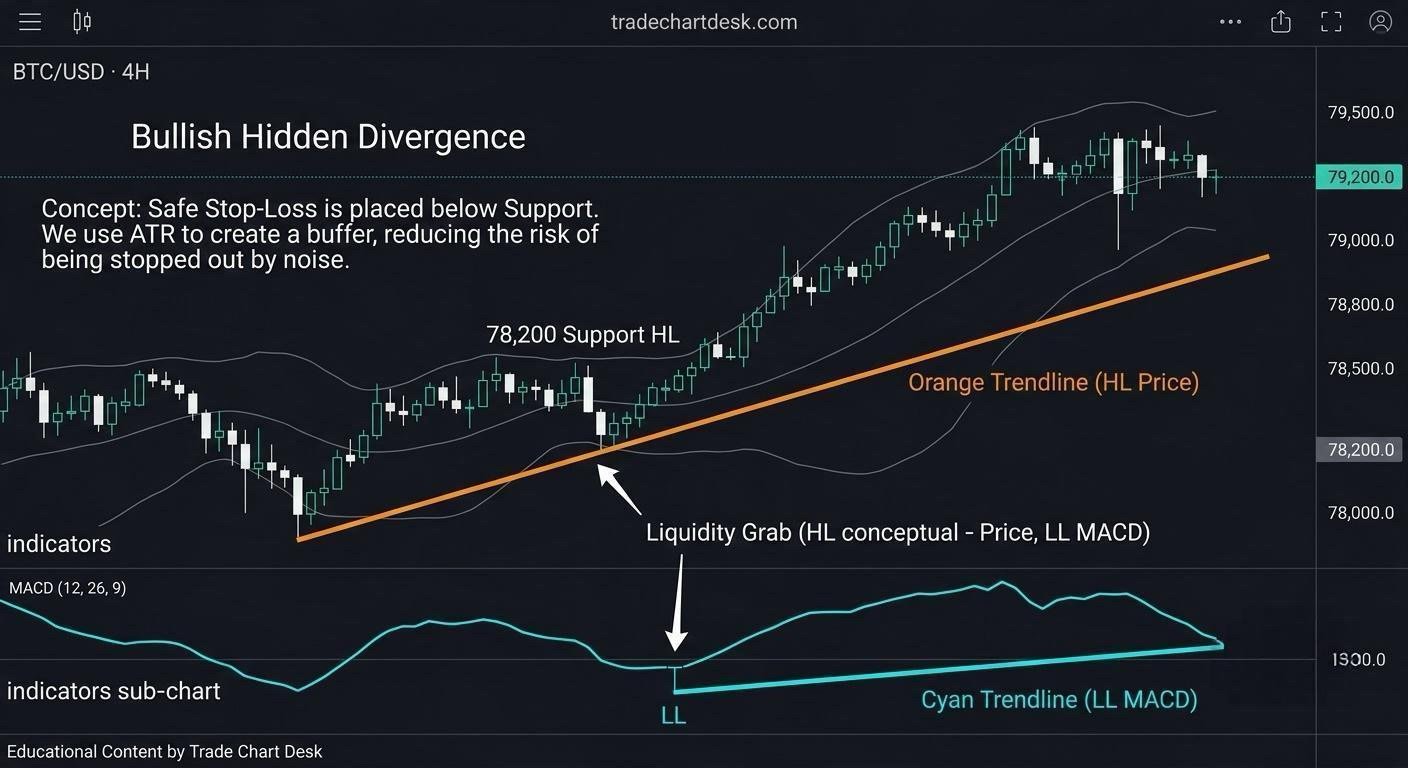
| Hidden bullish | Higher low | Lower low | Uptrend structure held despite a deep momentum dip; possible continuation |
| Hidden bearish | Lower high | Higher high | Downtrend structure held despite a strong momentum bounce; possible continuation |
A simple memory aid: regular divergence compares extremes (highs in uptrends, lows in downtrends) and points toward reversal. Hidden divergence compares pullbacks (lows in uptrends, highs in downtrends) and points toward continuation. For the reversal version applied to RSI, see our RSI divergence guide.
Why the logic is plausible (and where it stops)
MACD is built from moving averages of price, so a deep MACD low during a pullback means the pullback was sharp relative to the recent trend. If price still holds above its previous swing low, buyers absorbed that sharp move without letting the trend structure break. That is the whole argument.
What it does not tell you: whether the next leg will be large, when it will start, or whether the higher low will hold on the next test. MACD contains no information that is not already in price. It is a different view of the same data, not independent confirmation.
The real-time problem: pivots are only known later
On a finished chart, swing lows look obvious. In real time, a low is only a “swing low” once later bars have closed above it. If your rule defines a pivot as “the lowest low with 3 higher lows on each side,” you cannot know the pivot exists until 3 bars after it formed. Many divergence indicators draw their lines back onto the pivot bar, which makes historical charts look like the signal appeared at the exact bottom. It did not.
When you study past examples, always ask: “On which bar would I actually have known this?” That bar, not the pivot, is your earliest possible entry.
A step-by-step checklist
- Confirm the trend first. For a bullish setup, price should be making higher highs and higher lows on your trading timeframe. If you cannot point to two higher lows already, there is no trend to continue. Our guide to market structure covers this in detail.
- Fix your settings before looking. Choose the series (MACD line or histogram), the parameters, and the pivot definition (for example, 3 bars each side). Write them down.
- Identify two consecutive pullback lows using that pivot definition, and read the MACD value on the same bars.
- Check the pattern. Price low #2 > price low #1, and MACD low #2 < MACD low #1.
- Wait for a trigger. For example, a close above the high of the bar that confirmed the pivot. Without a trigger, you are buying a pullback that may still be falling.
- Place invalidation below low #2. If price breaks the higher low, the premise of the setup is gone.
- Size from the stop distance, not from conviction.
A worked example with illustrative numbers
The numbers below are invented to show the mechanics. They are not historical data or a forecast.
| Pullback low #1 | Pullback low #2 | |
|---|---|---|
| Price low | $61,200 | $62,050 |
| MACD histogram at that low | −180 | −260 |
Price made a higher low ($62,050 > $61,200) while the histogram made a lower low (−260 < −180): a hidden bullish pattern by the rules above.
- The pivot at $62,050 is confirmed three bars later. The trigger bar closes at $63,100, above the confirming bar’s high.
- Invalidation is placed just under the higher low at $61,950. Stop distance = $63,100 − $61,950 = $1,150.
- With a $10,000 account risking 1% ($100), position size = $100 ÷ $1,150 ≈ 0.087 BTC (about $5,490 notional).
- If the trend’s prior high is $65,400, the distance to it is $2,300, about 2R. That is a planned ratio, not an expected result.
Now the failure case. Price rallies to $63,600, stalls, and falls back through $61,950. The trade loses 1R plus fees. Nothing about the divergence was “wrong”; the pattern simply did not lead to continuation this time. A rule like this has to be judged across many occurrences, with losers included.
Common mistakes
- Mixing series. Comparing a MACD-line low with a histogram low is not a divergence.
- Finding divergence in a range. Without an established trend, “continuation” has no meaning.
- Using pivots you could not have known. See the real-time section above.
- Stacking indicators built from the same data. MACD, RSI and stochastic divergence appearing together is not three independent confirmations.
- Ignoring timeframe. A hidden bullish divergence on the 15-minute chart can sit inside a clear downtrend on the daily chart.
How to test the idea
Go through a chart bar by bar (TradingView’s Bar Replay is useful here) and log every occurrence that meets your written definition, not only the ones that worked. Record the trigger bar, entry, stop, and outcome in R. After 30 or more cases, compare the average R per trade with a simpler baseline, such as entering on any pullback to the 21 EMA in the same trend. If the divergence filter does not improve on the baseline after costs, it is not adding value for you.
Checklist in brief
- Hidden bullish divergence: higher price low + lower MACD low. Hidden bearish: lower price high + higher MACD high.
- Use one MACD series, fixed settings, and a fixed pivot definition.
- Pivots are confirmed after the fact; your entry can only come after confirmation.
- Invalidation sits beyond the higher low (or lower high). If it breaks, the setup is over.
Financial disclaimer: This article is for educational purposes only and is not financial, investment, or trading advice. Trading involves substantial risk of loss. All prices and indicator values above are illustrative.
1 thought on “MACD Hidden Divergence: How to Spot It, Confirm It, and Avoid False Signals”