
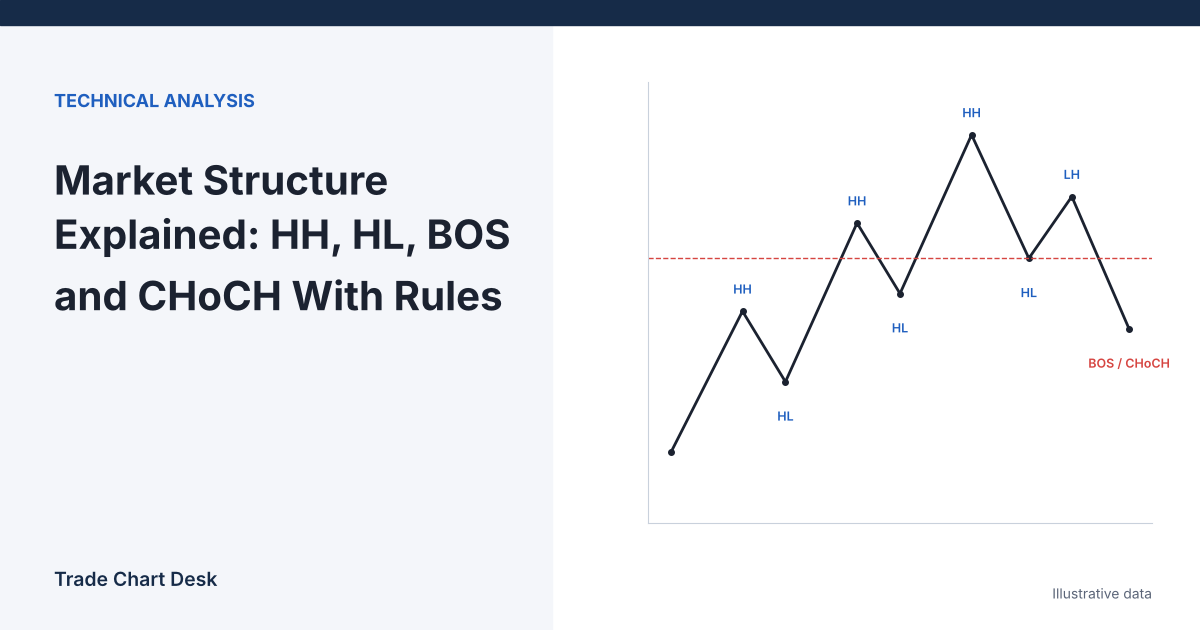
Ask five traders to mark the market structure on the same chart and you will often get five different answers. The labels themselves are simple: higher high (HH), higher low (HL), lower high (LH), lower low (LL), break of structure (BOS) and change of character (CHoCH). The disagreement comes from the step before labeling: deciding which wiggles count as swing points. This article gives you a written rule for that step, labels one illustrative sequence with it, and then shows how the conclusion changes when the rule changes. The goal is a structure read you could hand to someone else and have them reproduce.
The idea underneath the labels
The concept is old. Dow Theory described trends as a series of peaks and troughs, and modern education material still defines it that way: Fidelity’s basic concepts of trend describes an uptrend as ascending peaks and troughs and a downtrend as descending ones. BOS and CHoCH are newer names, popularised in “smart money concepts” content, for two specific events within that framework:
- BOS (break of structure): price breaks the most recent swing point in the direction of the current trend. In an uptrend, a close above the last swing high. It confirms continuation.
- CHoCH (change of character): price breaks the swing point that the current trend needed to hold. In an uptrend, a close below the last higher low. It is the first sign the sequence has stopped.
Neither term has an official standard definition. That is why the rules below matter more than the vocabulary.
Step zero: write your swing rule down
A workable rule has two parts.
- Pivot confirmation: a swing high is a bar whose high is higher than the highs of N bars on each side (N = 3 is a common starting point). Swing lows are the mirror image. This means every swing is confirmed N bars late.
- Minimum size: a new swing only counts if price has moved at least X% from the previous opposite swing. This filters out small noise. For an hourly BTC chart, 1% is a reasonable illustrative threshold; choose yours by looking at typical swing sizes on your market and timeframe.
You can see this rule in action without coding. TradingView’s Zigzag indicator has exactly these two inputs, a price deviation percentage and a pivot-legs count. Its help page also warns that the latest line is not final and can be redrawn if later price action invalidates the pivot. That warning applies to your manual labels too: the last swing on the chart is always provisional.
Add one more rule: breaks are judged on candle closes, not wicks. A wick through a level is a probe; a close through it is a break. You can use wicks if you prefer, but decide once and stay consistent.
Labeling one sequence
Illustrative 1-hour BTC/USDT swings, using N = 3 and a 1% minimum swing:
| Swing | Price | Move from previous swing | Label | Event |
|---|---|---|---|---|
| L1 | 58,200 | (start) | Low | |
| H1 | 59,400 | +2.06% | High | |
| L2 | 58,800 | −1.01% | HL | |
| H2 | 60,100 | +2.21% | HH | BOS up: a close above 59,400 on the way |
| L3 | 59,300 | −1.33% | HL | |
| H3 | 59,900 | +1.01% | LH | Failed to break 60,100: warning only |
| Then | close at 59,050 | Close below L3 (59,300): CHoCH by the “last HL” rule |
Read it in order. L1 to H2 is textbook: higher low at L2, then a close above H1 is a bullish BOS. L3 at 59,300 is another higher low. H3 tops at 59,900, below H2: that is a lower high, which weakens the trend but does not end it, because nothing the uptrend needed has broken. When a candle then closes at 59,050, below L3, the last higher low has failed. Under this rule, that close is the CHoCH.
A practical reading: before the CHoCH, a trader leaning long would treat 59,300 as the level the idea depends on. After it, the same trader stops looking for longs on this timeframe until a new higher low and BOS form. The structure tells you where your idea is wrong, which is more useful than telling you where price will go.
What changes if…
…you use a stricter swing filter?
H3 is only 1.01% above L3, barely over the 1% threshold (1% of 59,300 is 593; the move was 600). With a 1.5% minimum, H3 and L3 would not count as swings at all. The structure would read L1, H1, L2, H2, and the close at 59,050 would simply be a pullback inside the move from L2 to H2. No CHoCH. Same chart, opposite conclusion, from one setting.
…you define the protected low differently?
Some traders say only the swing low that produced the last BOS is protected. Here that is L2 at 58,800, because the rally from L2 broke H1. Under that rule, the close at 59,050 is not a CHoCH; the trend stays up until a close below 58,800. The “last HL” rule reacts 500 points earlier and will produce more false reversals; the “BOS origin” rule reacts later and gives back more when the reversal is real. Pick one and write it down.
…you look at a higher timeframe?
This whole sequence might be a single pullback on a 4-hour chart. Label the higher timeframe first, then treat lower-timeframe CHoCHs that go against it as pullbacks unless the higher timeframe also breaks.
Common mistakes
- Labeling after the fact. Swings drawn on a finished chart look obvious. In real time the last swing is unconfirmed for N bars. When reviewing, ask “what could I have labeled on that bar?”
- Calling every wick a BOS. Liquidity sweeps above highs and below lows are common in crypto. Our article on stop-loss hunting explains why stops cluster just beyond swing points.
- Treating a lower high as a reversal. An LH is a warning. The CHoCH is the break of the low.
- Ignoring volume and context. A BOS on thin weekend volume carries less information than one with clear participation. See volume confirmation for breakouts.
- Switching rules mid-trade. If the “last HL” rule says you are wrong, switching to the “BOS origin” rule to stay in is a decision made by hope.
A ten-minute exercise to check yourself
- Write your rule on paper: pivot N, minimum swing %, close or wick, which low is protected.
- Open a 1-hour chart from a period you have not studied. Use bar replay (or scroll so future bars are hidden) and step forward one bar at a time.
- Label each swing only once it is confirmed by your rule. Mark every BOS and CHoCH with the bar it became visible on.
- Turn on the Zigzag indicator with matching inputs and compare. Differences point to places where your manual reading drifted from your rule.
- Count how many CHoCHs were followed by a new LL within the next 20 bars and how many were followed by a new HH. That ratio is your own evidence, on your own rule, and it belongs in your trading journal.
Financial disclaimer: This article is for educational purposes only and is not financial, investment, or trading advice. Trading involves substantial risk of loss. Example figures are illustrative.