
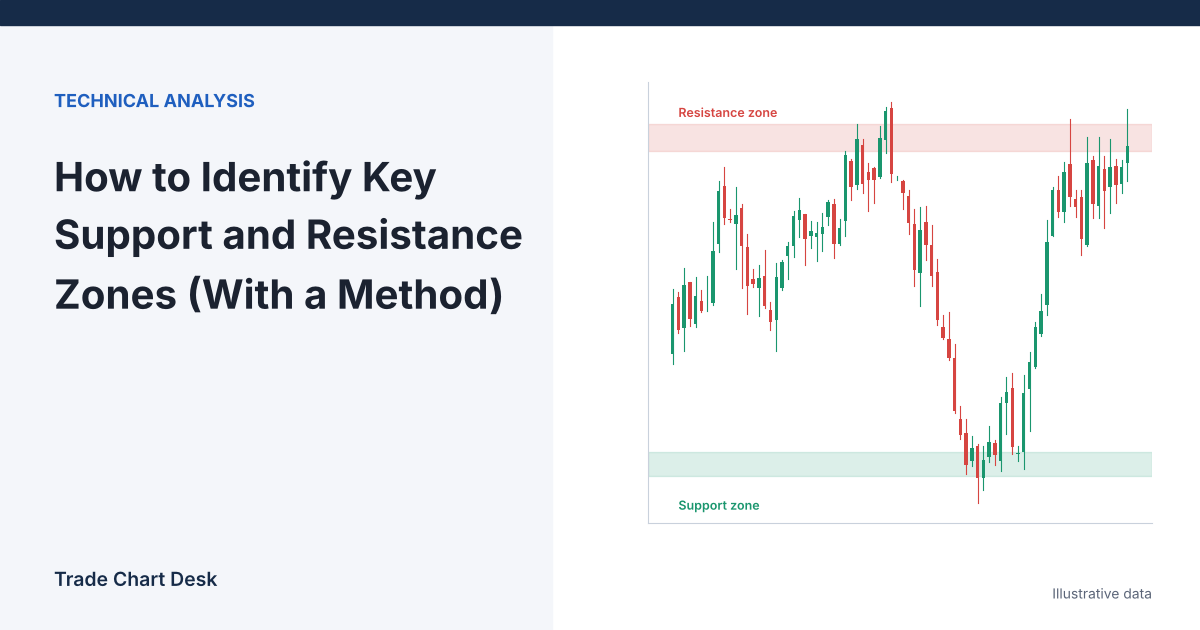
Open any Bitcoin chart, draw every horizontal line that “looks important,” and you will usually end up with eight or ten of them. Price is always near one of them, so every move seems to confirm your analysis. That is the real problem with support and resistance: not finding levels, but finding too many and having no way to rank them. This guide gives you a repeatable way to build zones, score them, and decide in advance what a level has to do before you act on it.
Four misconceptions that cause most bad levels
“Support is a price”
Support is an area where buying interest has previously been strong enough to stop a decline. Orders are spread across a range, different exchanges print slightly different highs and lows, and wicks overshoot. Treating support as a single price leads to stops placed exactly where everyone else’s are. Work with zones that have a top and a bottom.
“The more touches, the stronger the level”
Repeated touches show that a level matters to the market. They also show that buyers at that level are being used up each time. A fourth or fifth test that produces a smaller bounce than the first is often a level getting weaker, not stronger. Count touches, but also measure the size of the reaction after each one.
“Round numbers are just psychology”
There is evidence that round numbers matter for mechanical reasons. A Federal Reserve Bank of New York study of currency markets by Carol Osler found that support and resistance levels published by dealing firms clustered heavily on round numbers and predicted intraday trend interruptions better than arbitrary levels. A follow-up paper using actual bank order data found take-profit orders clustered at round numbers, while stop-loss orders clustered just beyond them. That is a plausible explanation for both the bounce and the acceleration after a break. These studies covered foreign exchange in the late 1990s, not crypto, so treat them as a reason to pay attention to round numbers, not as a crypto statistic.
“A break means the level is gone”
Broken support frequently becomes resistance on the way back up, and broken resistance becomes support. This “role reversal” is the basis of the retest entry covered in our breakout and retest guide. A broken level is not deleted from your chart; its job changes.
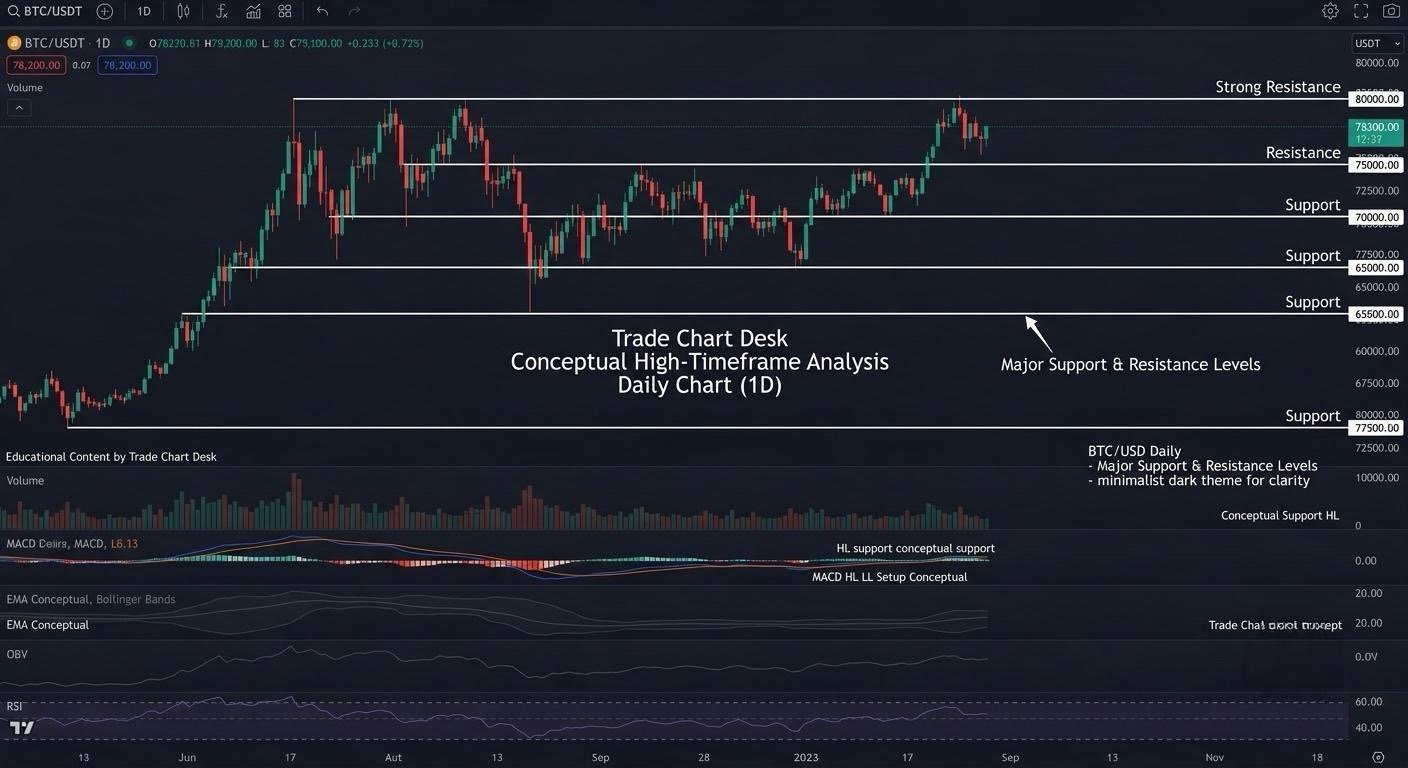
Building a zone: a five-step procedure
- Start on a higher timeframe. Mark levels on the daily chart first, then the 4-hour. Levels visible on the daily chart carry more weight than ones only visible on the 15-minute chart, because more participants see them.
- Find swing points, not candle bodies at random. A swing low is a low with higher lows on both sides. Use the same definition every time, for example at least two bars on each side.
- Group nearby swing points. If two or more swing lows sit within roughly one daily ATR (Average True Range) of each other, treat them as one area.
- Set the zone edges. Take the lowest and highest of the grouped swing points, then pad each side by a small fraction of ATR (for example 0.1 × ATR) to absorb wicks.
- Record the zone with a date. Write down when it was created and how many tests it has had. A zone you cannot describe in writing is a zone you will move later to fit the chart.
Worked example (illustrative numbers)
Suppose BTC on the daily chart has three swing lows over the past few months at $58,950, $59,120 and $59,300, and the daily ATR(14) is $2,400.
- The three lows are $350 apart in total, well inside one ATR, so they form one area.
- Padding: 0.1 × $2,400 = $240.
- Zone bottom: $58,950 − $240 = $58,710. Zone top: $59,300 + $240 = $59,540.
Notice that $60,000 sits just above the zone. If price is falling toward the area, the round number may attract the first reaction, before the zone itself is even touched. Keep both on the chart.
Scoring zones so you can rank them
Once you have zones, rank them. The weights below are a starting point you should adjust and then keep fixed while testing.
| Factor | Score 0 | Score 1 | Score 2 |
|---|---|---|---|
| Timeframe | Only intraday | 4-hour | Daily or weekly |
| Reaction size after tests | Under 1 ATR | 1–2 ATR | Over 2 ATR |
| Recency of last test | Over a year | 3–12 months | Under 3 months |
| Role reversal | No | Partial | Clear support-to-resistance flip, or the reverse |
| Volume at the level | Thin | Average | High-volume node on a volume profile |
A zone scoring 7 or more out of 10 is a “key” level for your plan; 4 to 6 is a level to watch; below 4 can usually be deleted. The exact threshold matters less than using the same one every time.
From zone to trade plan
A level is not an entry. It is a place where you will look for evidence. Continuing the example, assume price falls into the $58,710–$59,540 zone, prints a 4-hour candle with a long lower wick, and closes back at $59,400. A plan might look like this:
- Entry: $59,400, after the close confirms rejection.
- Stop: below the zone plus the same padding: $58,710 − $240 = $58,470. Risk per BTC: $59,400 − $58,470 = $930.
- Target: the bottom edge of the next resistance zone, say $62,600. Reward per BTC: $3,200.
- Reward-to-risk: $3,200 ÷ $930 ≈ 3.4.
- Size: with a $10,000 account risking 1% ($100), position size = $100 ÷ $930 ≈ 0.108 BTC.
If the next resistance had been at $60,200 instead, reward would drop to $800 and the ratio to about 0.86, which most traders would skip. This is where support and resistance earns its keep: not by predicting the bounce, but by telling you in advance whether the trade is worth taking. Our reward-to-risk guide covers how that ratio interacts with win rate.
How levels fail
- The slow grind. Price returns to a zone repeatedly with shrinking bounces, then slices through. Shrinking reactions were the warning.
- The sweep. Price wicks below the zone, triggers clustered stops, and reverses. Your stop was in the obvious place. Padding by ATR helps, but no padding is immune. See stop-loss hunting explained.
- News overrides structure. A CPI print or exchange incident can move price through any level in one candle. Check the calendar before relying on a zone.
- Exchange differences. A low that defines your zone on one exchange may be several hundred dollars different elsewhere, especially during spikes. Pick one data source and stick with it.
- Hindsight drawing. Levels drawn after the fact always look perfect. The only fair test is a level drawn before price returns to it.
Test your own levels
You can measure whether your levels are useful without trusting anyone’s claims:
- Each weekend, draw your zones on the daily chart and screenshot them with the date visible. Do not edit them during the week.
- For each zone that price reaches, record whether it reacted by at least 1 ATR before closing through the far edge.
- Do the same for a control: a few arbitrary horizontal zones of the same width, placed at random prices near the current price.
- After 30 or more tests, compare the reaction rate of your zones against the arbitrary ones. If they are not clearly better, your selection rules need work.
This mirrors the comparison Osler made in the Fed study, and it is the most honest feedback you can get. A trading journal makes the record-keeping easier.
Financial disclaimer: This article is for educational purposes only and is not financial, investment, or trading advice. Trading involves substantial risk of loss. Example figures are illustrative.
4 thoughts on “How to Identify Key Support and Resistance Zones (With a Method)”