
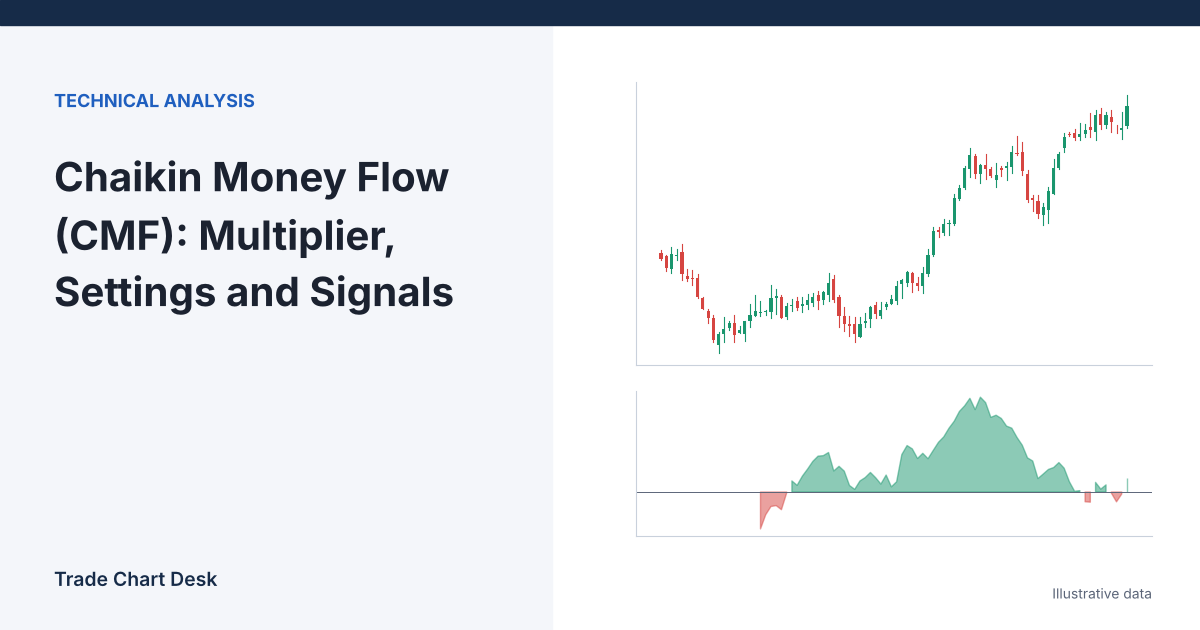
Here is a situation that confuses people the first time they add Chaikin Money Flow to a chart: price falls for three bars in a row, and CMF stays positive. Nothing is broken. CMF never asks whether price went up or down. It asks a narrower question about each bar on its own: where inside this bar’s range did the close finish, and how much volume traded? If a coin keeps closing near the top of its bars while drifting lower, CMF reads that as accumulation.
That one design choice explains almost every CMF signal and almost every CMF failure. This guide builds it from the bar level up.
The building block: the money flow multiplier
CMF was developed by Marc Chaikin, who also built the Accumulation/Distribution Line and the Chaikin Oscillator. Both TradingView’s Chaikin Money Flow help page and StockCharts’ ChartSchool CMF article use the same three steps:
- Money flow multiplier = [(Close − Low) − (High − Close)] / (High − Low)
- Money flow volume = Multiplier × Volume
- CMF = sum of money flow volume over N bars / sum of volume over N bars
The multiplier runs from −1 to +1:
- Close exactly at the high: +1. All of the bar’s volume counts as accumulation.
- Close exactly at the middle of the range: 0. The bar’s volume counts for nothing.
- Close exactly at the low: −1. All of it counts as distribution.
A quick mental shortcut: if the close sits at 80% of the way up the bar, the multiplier is 2 × 0.80 − 1 = +0.6.
Settings: 20 or 21, and why it barely matters which
TradingView’s built-in CMF loads with a length of 20, the same default StockCharts uses. TradingView’s own help page works its example with 21, and ChartSchool notes that 20 or 21 periods are both typical. They come from the stock market, where roughly 20 to 21 trading days make a month. In crypto, which trades every day, 20 daily bars is under three weeks, and 20 hourly bars is less than a day. Pick the length based on the time window you actually want to summarize, not on the number.
A worked example: five bars, one falling stretch
Illustrative 4-hour bars for an ETH pair. Volume is in ETH. Over bars C to E, price closes lower each time.
| Bar | High | Low | Close | Close position in range | Multiplier | Volume | Money flow volume |
|---|---|---|---|---|---|---|---|
| A | 2,010 | 1,950 | 2,000 | 83% | +0.667 | 4,000 | +2,666.7 |
| B | 2,060 | 1,995 | 2,055 | 92% | +0.846 | 5,000 | +4,230.8 |
| C | 2,070 | 2,030 | 2,034 | 10% | −0.800 | 9,000 | −7,200.0 |
| D | 2,040 | 1,980 | 2,028 | 80% | +0.600 | 6,000 | +3,600.0 |
| E | 2,030 | 1,900 | 1,985 | 65% | +0.308 | 7,000 | +2,153.8 |
Sum of money flow volume = 2,666.7 + 4,230.8 − 7,200.0 + 3,600.0 + 2,153.8 = 5,451.3. Sum of volume = 31,000. CMF(5) = 5,451.3 / 31,000 = +0.176.
Price closed 3.4% lower at E than at B, yet CMF is clearly positive. Bars D and E both closed lower than the bar before them, but both recovered into the upper part of their own range before closing. That intrabar recovery is what CMF interprets as buying pressure. Bar C, the only bar that closed near its low, was also the heaviest bar, and it still was not enough to flip the sum.
What changes if…
- …bar E closed near its low instead (1,905 instead of 1,985)? Its multiplier becomes −0.923 and its money flow volume −6,461.5. CMF(5) drops to −0.102. One bar’s closing position moved the reading by about 0.28.
- …bar C had traded 3,000 ETH instead of 9,000? Its negative contribution shrinks to −2,400, total volume falls to 25,000, and CMF(5) rises to +0.410. The heavy distribution bar was holding the reading down.
Both of these are the same lesson from two directions: CMF over a short window is a weighted vote, and the heaviest bars with closes near either extreme cast most of the vote.
Reading CMF levels
| CMF reading | What it tells you | Note |
|---|---|---|
| Above +0.05 | Over the window, volume-weighted closes have been in the upper part of their bars | The +/−0.05 buffer is suggested by both TradingView and ChartSchool to reduce zero-line whipsaws |
| Between −0.05 and +0.05 | No clear tilt | Treat zero-line crosses inside this band as noise |
| Below −0.05 | Closes have tended to be in the lower part of their bars, weighted by volume | Same buffer logic |
| Beyond about ±0.5 | Unusually one-sided | ChartSchool notes CMF typically stays between −0.5 and +0.5; ±1 would need every bar to close at its extreme |
Three ways traders use it
1. A filter on a price signal
The most defensible use. You already have a setup from price, such as a range breakout, and you only take it if CMF agrees (for example, above +0.05 for a long). CMF is not generating the trade, it is vetoing ones where closes have been weak. This pairs naturally with the methods in our volume confirmation guide.
2. Persistence rather than crosses
Instead of reacting to each zero-line cross, some traders count how many of the last N bars CMF stayed on one side of the buffer. A reading that has held above +0.05 for 15 of the last 20 bars says something different from one that just crossed.
3. Divergence with price
Price makes a lower low while CMF makes a higher low, as in the five-bar example above. This is the weakest of the three, because as the example shows, the divergence can come from one or two bars’ closing positions.
Where CMF breaks
- It ignores gaps and bar-to-bar change. The multiplier looks only inside each bar. ChartSchool shows stock examples where CMF rose after a down gap because the close was in the upper half of the range. Crypto spot rarely gaps, but the equivalent is the falling-closes case above.
- Wicks dominate. A long lower wick from a brief liquidation sweep moves the low far down, so a close that recovers even partway gets a positive multiplier. CMF can read a stop-run as accumulation. Our article on stop-loss hunting explains why those wicks form.
- Doji bars with zero range. If high equals low, the multiplier divides by zero. Platforms handle it differently, so a quiet market on a low-timeframe chart can produce odd values.
- Single-venue volume. The volume is your data feed’s exchange. A different venue can produce a different CMF on the same coin.
- Short windows on low timeframes. CMF(20) on 5-minute bars is less than two hours of data. A single news candle can control it.
CMF versus MFI: same name, different question
| Chaikin Money Flow | Money Flow Index | |
|---|---|---|
| Classifies each bar by | Close position within the bar’s own range | Whether typical price rose or fell versus the prior bar |
| Partial credit? | Yes, multiplier from −1 to +1 | No, the whole bar goes to positive or negative |
| Scale | −1 to +1, centered on zero | 0 to 100, RSI-style |
| Typical default | 20 | 14 |
| Bars B to E above | CMF(4) = +0.103 | MFI(4) = 52.5 |
On the last four bars of the example, MFI sees two rising and two falling typical prices with similar money flow and lands near neutral. CMF sees three of four bars closing in their upper range and leans positive. If you want the bar-to-bar version, our Money Flow Index guide walks through it. If you want the all-or-nothing close-to-close version, see On-Balance Volume.
How to check a CMF signal yourself
- Export the bars in the current CMF window. Add a multiplier column:
=((D2-C2)-(B2-D2))/(B2-C2)where B is high, C is low, D is close. - Multiply by volume and sum. Divide by summed volume. Confirm you match the chart.
- Sort the window by the absolute value of money flow volume. If the top two bars account for more than half the total, write “two-bar signal” next to the reading in your journal.
- Look at those top bars on the chart. Are they long-wick sweep bars? If so, the reading describes a wick, not steady accumulation.
Financial disclaimer: This article is for educational purposes only and is not financial, investment, or trading advice. Trading involves substantial risk of loss. Example figures are illustrative.
1 thought on “Chaikin Money Flow (CMF): Multiplier, Settings and Signals”