
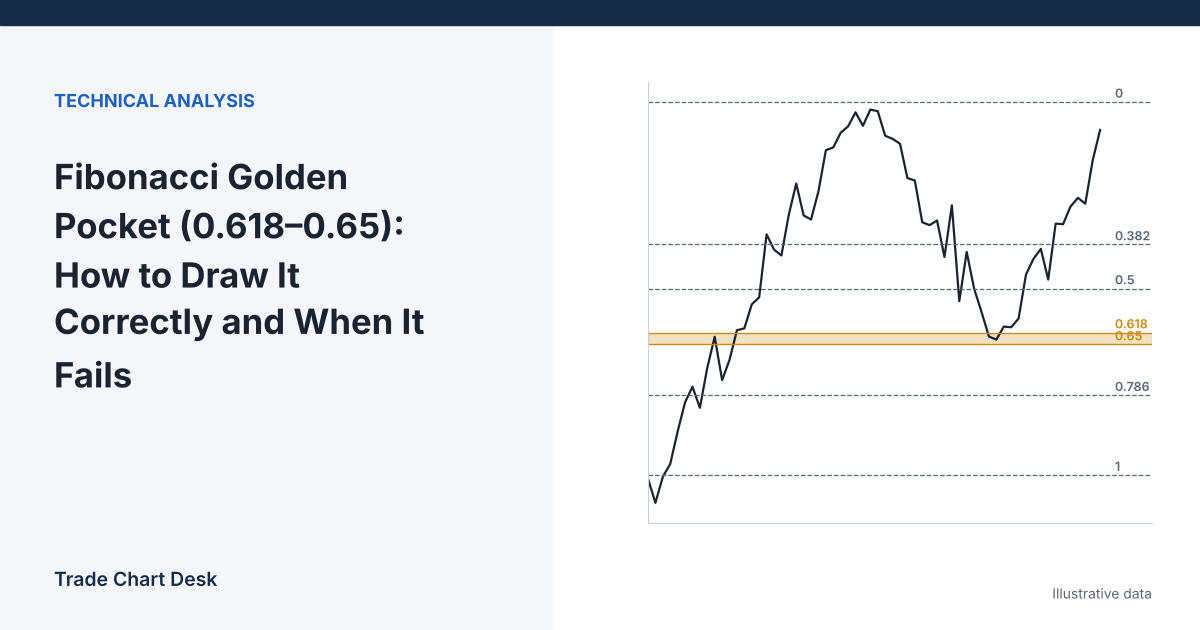
The “golden pocket” is the zone between the 61.8% and 65% Fibonacci retracement of a price swing. It is popular because it is simple to draw and easy to remember. It is also easy to draw differently from the trader next to you and end up with a completely different zone. This guide covers the arithmetic, the three settings that quietly change your levels, and a practical way to decide whether a reaction in the zone means anything.
Where the numbers come from
The 61.8% level comes from the golden ratio (about 1.618; its reciprocal is about 0.618). The 65% boundary is a trading convention, not a Fibonacci ratio. Some traders use 0.618–0.66 or 0.618–0.65; the name “golden pocket” simply refers to a narrow band around 0.618.
A retracement percentage measures how much of a move has been given back. A 61.8% retracement means price has given back 61.8% of the selected swing. It says nothing about the probability of a bounce. The ratios alone do not establish a market mechanism or a reliable trading advantage. Whether a particular rule adds value requires testing; a selected bounce cannot establish its success rate.
The formula
For an upward swing from Low (L) to High (H), the retracement level for fraction r on a linear chart is:
Level = H − r × (H − L)
For a downward swing, a rebound level is L + r × (H − L).
Worked example
Assume price rises from $72,000 to $79,000 (illustrative numbers, not a market forecast). The swing is $7,000.
- 61.8%: $79,000 − 0.618 × $7,000 = $74,674
- 65%: $79,000 − 0.65 × $7,000 = $74,450
The golden pocket is $74,450–$74,674, a band of $224.
| Retracement | Calculation | Price |
|---|---|---|
| 0% | $79,000 − 0 × $7,000 | $79,000 |
| 50% | $79,000 − 0.5 × $7,000 | $75,500 |
| 61.8% | $79,000 − 0.618 × $7,000 | $74,674 |
| 65% | $79,000 − 0.65 × $7,000 | $74,450 |
| 100% | $79,000 − 1 × $7,000 | $72,000 |
The pocket runs from $74,450 to $74,674. These calculated reference levels do not predict a bounce.
Three settings that change your levels
Two traders can look at the same chart and draw pockets that do not overlap. These are the usual reasons.
1. Wick vs. candle body anchors
Suppose the swing high candle had a wick to $79,000 but closed at $78,400. Anchoring to the close instead of the wick gives:
- 61.8%: $78,400 − 0.618 × $6,400 = $74,445
- 65%: $78,400 − 0.65 × $6,400 = $74,240
That pocket ($74,240–$74,445) ends about $5 below the wick-based one. Neither choice is “correct”; what matters is using the same rule every time.
2. Linear vs. logarithmic scale
When logarithmic retracement calculation is enabled in the drawing tool, levels divide the logarithm of the price ratio. A logarithmic chart display alone does not necessarily enable that calculation. The level becomes H × (L ÷ H)r. For the $72,000–$79,000 swing, the 61.8% log level is about $74,598 instead of $74,674. For small swings the difference is minor.
For large swings it is not. On a move from $20,000 to $60,000:
| Level | Linear | Logarithmic |
|---|---|---|
| 61.8% | $35,280 | ≈ $30,429 |
| 65% | $34,000 | ≈ $29,378 |
Roughly a $5,000 difference. On long-term crypto charts, where moves of several hundred percent are common, check which scale your tool uses. TradingView’s Fibonacci retracement tool settings include options for this.
3. Which swing you choose
This is the biggest source of disagreement. A swing chosen on the 4-hour chart and a swing chosen on the daily chart produce different pockets. Choose anchors with a written rule (for example, “the most recent swing that produced a new higher high on the 4-hour chart”) rather than adjusting them until a past bounce lines up.
When the pocket is worth watching
On its own, a Fibonacci level is just a line. It becomes more interesting when it overlaps with something the market has already shown it cares about:
- A previous resistance level that is now acting as support (see our guide to identifying support and resistance).
- The top or bottom of a prior consolidation range.
- A high-volume node on a volume profile.
Be careful with “confluence” from indicators derived from the same price, such as an RSI reading or a moving average. They are not independent evidence.
Reaction, not touch
Placing a limit order inside the pocket and hoping is the simplest approach, but it means buying while price is still falling. An alternative is to require evidence of a reaction first:
- Price trades into the pocket.
- A candle closes back above the top of the pocket, or price forms a higher low on a lower timeframe.
- Entry on that confirmation, with invalidation below a level that would clearly break the setup.
Waiting for a reclaim can avoid some entries while price is still falling, but it can also delay entry or miss a move. Whether this improves results must be tested after costs.
Sizing the trade
Suppose you enter at $74,450 after a reaction, and decide the setup is invalid if price trades below the prior structure low at $73,300. Stop distance = $1,150. With a $10,000 account risking 1% ($100), size = $100 ÷ $1,150 ≈ 0.087 BTC. A tighter stop placed just under the pocket would allow a larger size but would also be hit by ordinary noise far more often. Set the stop where the idea is wrong, then let size adjust.
How the setup fails
- Price never reaches the pocket. Strong trends often retrace only 38.2% or 50%. You simply miss the trade.
- Price slices through. The pocket gives no reaction and price continues toward the 78.6% level or the full swing low.
- Price reacts, then fails. A bounce from the pocket stalls below the prior high and rolls over.
All three are normal. A rule built on the golden pocket should be judged on all of its outcomes, including missed trades and partial bounces.
How to test it yourself
Write your anchor rule, scale setting and entry trigger, then step through history bar by bar. For every swing that qualifies under your rule, log whether price reached the pocket, whether your trigger fired, and the result in R. Compare with a simple alternative such as entering at the 50% level using the same trigger. If the pocket does not do better after fees, the extra precision is not helping you.
Before you draw your next pocket
- The golden pocket is the 61.8%–65% retracement of a chosen swing; the 65% edge is a convention.
- Anchors (wick or body), scale (linear or log) and swing selection can move the zone significantly.
- Look for overlap with real structure, and for a reaction rather than a touch.
- Put the stop where the idea is invalid and size the position from that distance.
Financial disclaimer: This article is for educational purposes only and is not financial, investment, or trading advice. Trading involves substantial risk of loss. All prices above are illustrative.