
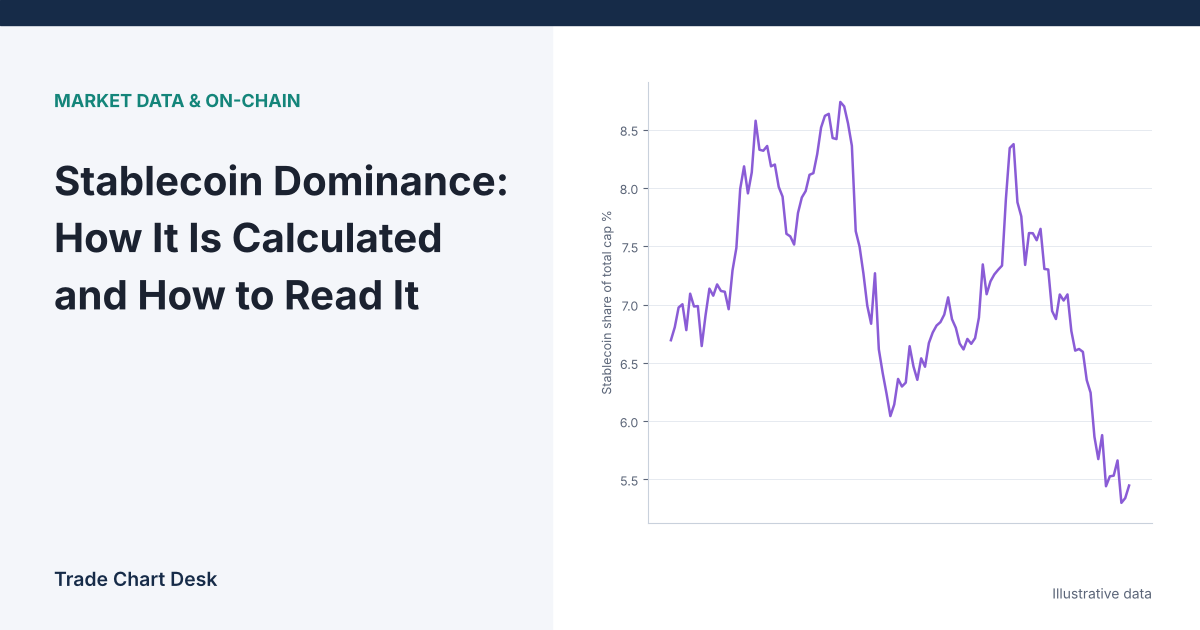
Here is a puzzle worth solving before you ever draw a trendline on a stablecoin dominance chart. Suppose not a single new stablecoin is minted and none are redeemed, yet stablecoin dominance rises from 10.0% to 12.2% in a week. Did traders “flee to stablecoins”? Not necessarily. Nothing about stablecoins changed at all. The rest of the market simply fell.
Stablecoin dominance is a ratio, and a ratio can move because of its top or its bottom. This article shows how the major data providers compute it, how to split any move into its two causes, and where the chart misleads people.
The formula, and why the denominator matters most
Stablecoin dominance = total stablecoin market cap ÷ total crypto market cap × 100
Because stablecoins are designed to hold about $1, the numerator usually moves slowly: it changes mainly when coins are minted or redeemed. The denominator contains Bitcoin, Ether and every other volatile asset, so it moves far more on most days. In practice, short-term swings in stablecoin dominance are mostly a mirror image of the rest of the market.
Splitting a move into its two parts
Use one illustrative starting point: total crypto market cap of $3,000B, of which stablecoins are $300B. Dominance is 300 ÷ 3,000 = 10.0%. Non-stablecoin assets are worth $2,700B.
| Scenario | Stablecoins | Everything else | Dominance | What actually happened |
|---|---|---|---|---|
| A. Market falls 20%, no minting | $300B | $2,160B | 12.2% | Pure denominator effect |
| B. $30B new stablecoins minted, market flat | $330B | $2,700B | 10.9% | Pure numerator effect |
| C. $30B minted and market rises 10% | $330B | $2,970B | 10.0% | Both moved; ratio unchanged |
Scenario A is the one that fools people: the biggest rise in dominance came with zero new stablecoin demand. Scenario C is the mirror trap: $30B of fresh stablecoin supply, a meaningful event, is invisible on the dominance chart because prices rose at the same pace.
The fix is simple. Never read the dominance chart alone. Put three lines next to each other: stablecoin dominance, total stablecoin market cap, and total market cap (or total market cap excluding stablecoins). The two raw series tell you which side of the ratio moved.
Which chart are you actually looking at?
“Stablecoin dominance” is not one standardized number. Each provider uses its own coin list, its own definition of a stablecoin, and its own supply data.
| Source | What it shows | Points to watch |
|---|---|---|
TradingView CRYPTOCAP:USDT.D |
Tether (USDT) alone as a share of TOTAL | Single coin, not all stablecoins. Shifts between USDT and USDC change it even when total stablecoin supply is flat. |
TradingView CRYPTOCAP:STABLE.C.D |
Stablecoin category index as a share of the 125-coin total | Category membership and the top-125 universe are TradingView’s choices; added in May 2025, so history on that symbol is shorter. |
| CoinGecko global charts | Stablecoin market cap and its share of total crypto market cap | CoinGecko excludes wrapped, bridged and staked tokens from its global total to avoid double counting. |
| CoinMarketCap | Market cap as price × circulating supply; dominance shown on its charts | Its tracked universe and circulating supply estimates differ from CoinGecko’s, so the same day can show a different percentage. |
TradingView’s help page on crypto market cap and dominance states that its dominance symbols use symbol ÷ TOTAL × 100%, and that TOTAL is the market cap of the top 125 coins in its screener. CoinGecko’s global charts show its stablecoin share alongside the note that crypto-backed tokens are excluded from the total. Because the denominators differ, compare readings only within one provider, and write down which symbol you used.
How to read it, step by step
- Pick one series and stick with it. For “all stablecoins,” STABLE.C.D on TradingView or the CoinGecko stablecoin share are closer to the concept than USDT.D.
- Check the numerator. Did total stablecoin market cap rise, fall, or stay flat over the same window? Supply trackers such as CoinGecko’s stablecoin category page or DefiLlama show this directly.
- Check the denominator. Did the non-stablecoin market rise or fall? On TradingView,
TOTALESis the 125-coin total excluding stablecoins. - Label the move. Denominator-driven (prices moved), numerator-driven (minting or redemptions), or mixed.
- Only then compare with price. A numerator-driven rise means new dollars are parked on crypto rails, which can later be spent in either direction. A denominator-driven rise just restates that prices fell.
A related ratio: stablecoin supply ratio
Some analysts flip the question and divide Bitcoin’s market cap by total stablecoin market cap. Glassnode calls this the Stablecoin Supply Ratio (SSR). A lower SSR means stablecoins are large relative to Bitcoin. It has the same two-sided problem: it falls when stablecoins grow and also when Bitcoin’s price falls.
Where the chart misleads
- Treating it as an inverted price chart and nothing more. Many traders overlay an inverted USDT.D on Bitcoin and draw the same patterns on both. Because the denominator dominates, the two will look similar most of the time almost by construction. That resemblance is not independent confirmation.
- Depegs. If a large stablecoin trades below $1, its market cap falls with its price, and stablecoin dominance drops at the moment traders are most likely fleeing to safety. The chart can show the opposite of the behavior people expect.
- Issuer-specific events. Regulatory changes, delistings in one region, or large mints for a single exchange’s needs move USDT.D or USDC share without saying anything about the broad market.
- Index rebalancing. When coins enter or leave a provider’s top 125 or its stablecoin category, the series can step up or down overnight.
- Stablecoins outside the index. Supply on chains or in tokens a provider does not track is not in the number. The ratio describes the provider’s universe, not the whole economy of on-chain dollars.
A decision checklist before you use it
- Which provider and symbol? Is it a single coin or the whole category?
- Over my chosen window, how much did total stablecoin supply change, in dollars?
- How much did the non-stablecoin market change?
- Was any major stablecoin off its peg in the window?
- Am I using this as context, or as an entry signal? If an entry signal, what will I do differently from simply reading the BTC chart?
Stablecoin dominance fits best as a market-regime lens alongside other breadth measures. Our guides to the altcoin season index and to ETF inflows cover two other ways to see where money is moving. If stablecoins arriving on exchanges is your real question, exchange inflow data is more direct than any market cap ratio.
Test it on your own data
Export daily values for STABLE.C.D, the stablecoin category market cap and TOTALES for the same period. In a spreadsheet, add a column for the daily percentage change of each. Then tag each week where dominance moved more than one percentage point as “numerator,” “denominator,” or “mixed,” using the rule that whichever raw series changed more in percentage terms is the main driver. After a few months of data you will see for yourself how often a dominance spike was just a price move, which is the most useful thing this chart can teach you.
Financial disclaimer: This article is for educational purposes only and is not financial, investment, or trading advice. Trading involves substantial risk of loss. Example figures are illustrative.
1 thought on “Stablecoin Dominance: How It Is Calculated and How to Read It”