
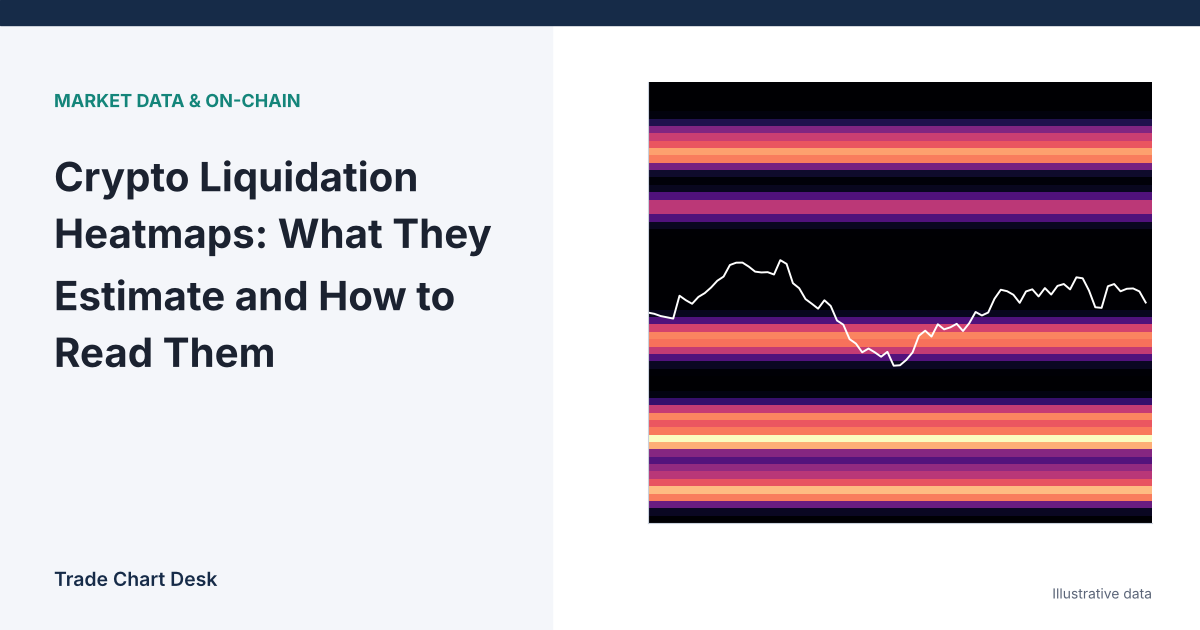
The most common misreading of a liquidation heatmap is treating the bright yellow band as a wall of real orders sitting at that price. It is not. No exchange publishes the liquidation prices of other traders’ positions. Every heatmap you see on a data site is a model’s guess, built from public data plus assumptions about how much leverage people used. Once you know which assumptions go into that guess, the chart becomes much more useful, and its blind spots become obvious.
What the colors actually represent
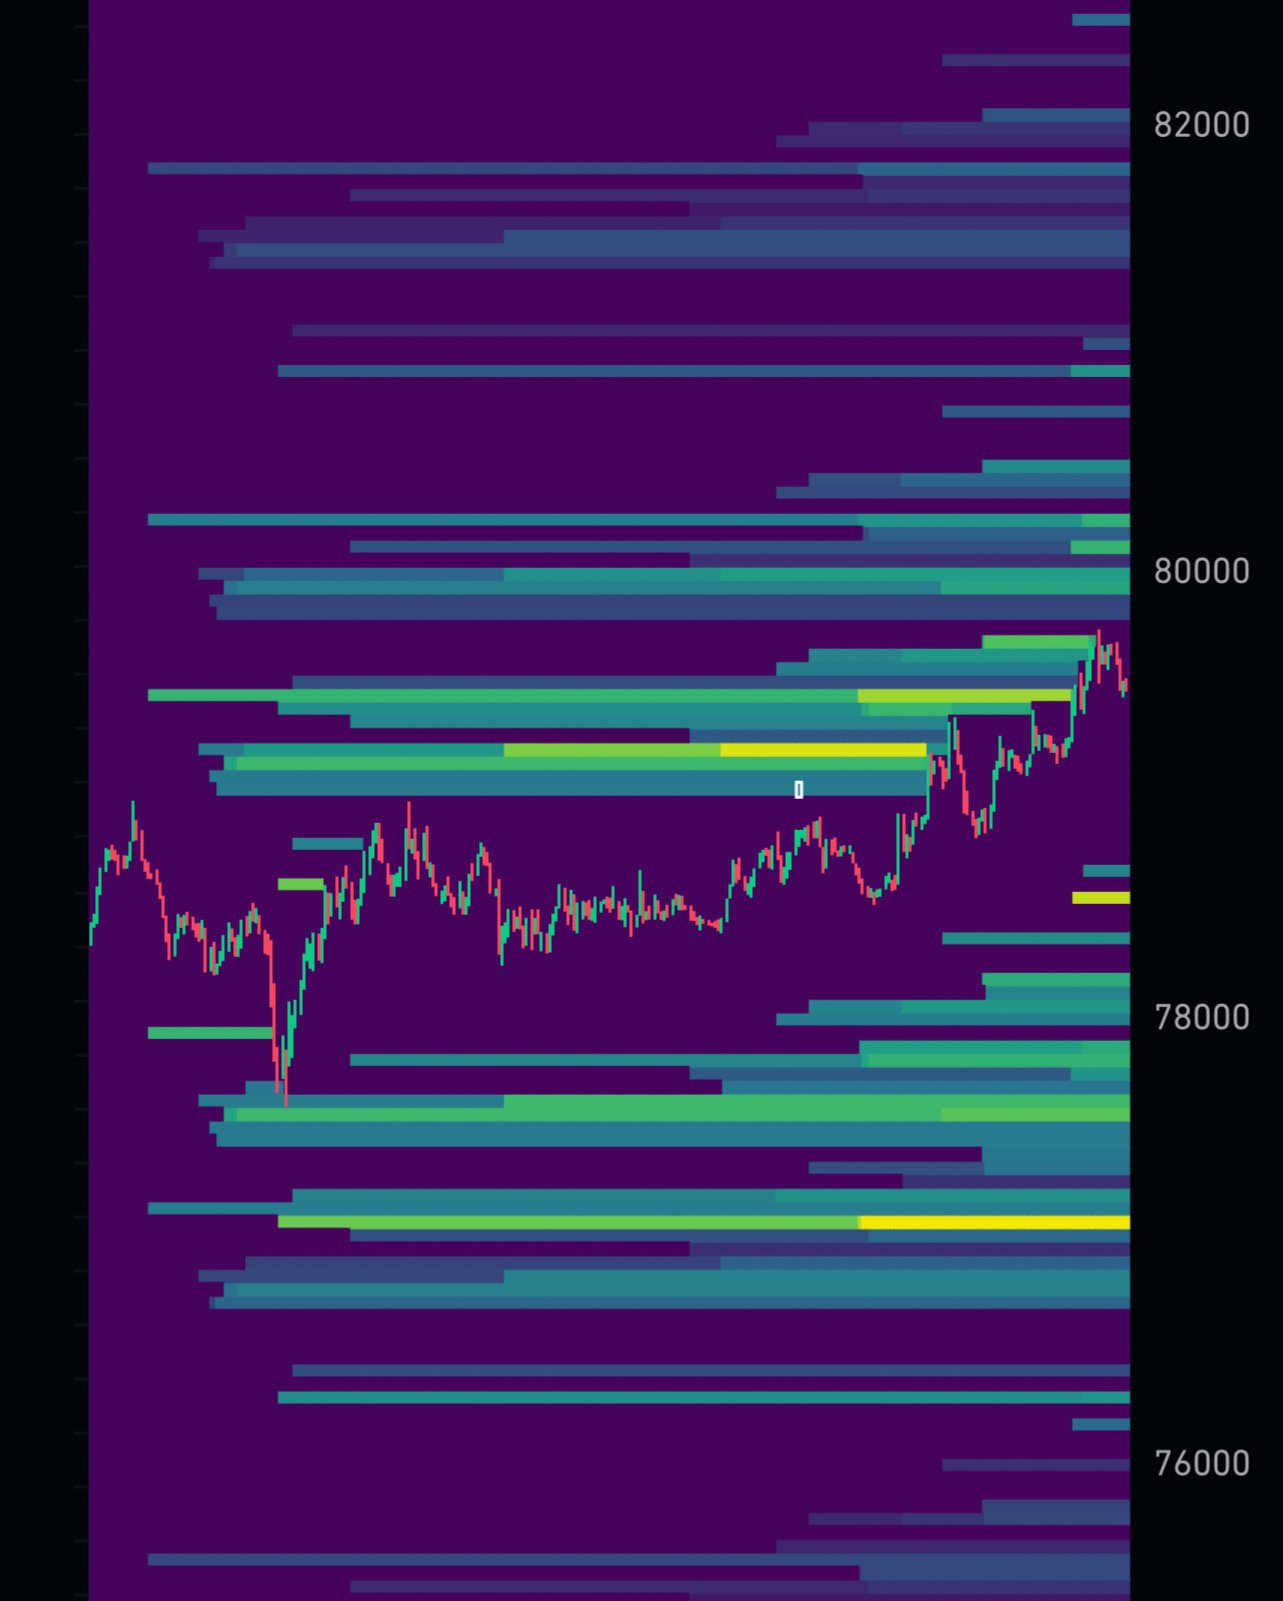
CoinGlass, one of the most widely used providers, describes its heatmap as an estimate that uses “complex algorithms” applied to market data and several leverage levels, with warmer colors (yellow) marking where predicted liquidations are most concentrated. Its own explainer is explicit on two points worth remembering:
- The map shows where liquidations might be triggered, not how many will actually happen.
- Actual forced liquidations are often smaller than the intensity suggests, so the scale is best read as relative: this band versus that band, not “$X will be liquidated here.”
Providers do not publish their full methodology, and they differ from each other. So the useful question is not “what does the map say?” but “what would have to be true for this band to be real?”
How an estimate like this is built
Any model of this kind has to do three things, whatever its exact recipe:
- Guess where positions were opened. When open interest rises while price trades in a zone, the model assumes new positions were opened near those prices. (If you are unsure what open interest measures, our guide to open interest spikes covers it.)
- Assume a leverage mix. It spreads those positions across leverage levels such as 10x, 25x, 50x and 100x. The real mix is unknown.
- Convert each bucket into a liquidation price. Using an approximate liquidation formula, each entry price and leverage level becomes a price below (for longs) or above (for shorts) the entry.
Overlapping estimates stack up, and the stacks become the bright bands. That is the whole trick. It is reasonable logic, but every step is an inference.
The calculation behind one band
Here is a simplified version you can do by hand. For an isolated-margin position, ignoring fees and funding, a rough liquidation price is:
- Long:
Entry × (1 − 1/Leverage + MMR) - Short:
Entry × (1 + 1/Leverage − MMR)
MMR is the maintenance margin rate. It varies by exchange, contract and position size; 0.5% is used below purely for illustration. Suppose a model believes a lot of positions were opened around an illustrative price of $80,000:
| Leverage | Long liquidation (approx.) | Short liquidation (approx.) | Distance from entry |
|---|---|---|---|
| 10x | $72,400 | $87,600 | 9.5% |
| 25x | $77,200 | $82,800 | 3.5% |
| 50x | $78,800 | $81,200 | 1.5% |
| 100x | $79,600 | $80,400 | 0.5% |
Two things fall out of this table. First, high-leverage bands sit very close to price, which is why the map often looks “hot” right next to the current candle. Second, a single entry zone produces four separate bands on each side. If the model’s leverage mix is wrong (say most traders actually used 5x, not 25x), the bands move a long way. Real exchange formulas also include tiered maintenance margin, fees, and, on cross margin, the whole account balance, so the actual liquidation prices are different again. Our article on cross vs. isolated margin shows how much cross margin can shift that level.
Reading a heatmap in four passes
Instead of glancing at the brightest color, go through the chart in a fixed order.
Pass 1: Set the frame
Check the lookback period (12 hours, 24 hours, one week, one month) and which exchanges are included. A band that appears on a 24-hour view but vanishes on the one-week view was built from recent, short-lived positioning. Write down the setting so you compare like with like.
Pass 2: Locate the nearest band on each side
Note the closest meaningful band above price and below it, and the distance to each in percent. A band 0.4% away is in normal noise range for BTC on many days; a band 6% away is a different situation. Compare the distance to the current ATR on your trading timeframe.
Pass 3: Judge the asymmetry, not the absolute size
If the band above is clearly brighter than the band below, the model thinks more short positions are vulnerable on the upside. Because the scale is relative, “brighter than the other side” is a more defensible reading than “huge.”
Pass 4: Cross-check with live data
Look at open interest and funding. A bright band built during a period when open interest later dropped sharply may already be gone, because those positions were closed. Rising open interest plus strongly positive funding makes a band of long liquidations below price more plausible; falling open interest makes any band less trustworthy.
What usually happens when price reaches a band
If a band is real, price touching it triggers forced market orders. Long liquidations are forced sells, so they can push price lower and into the next band, which is the cascade traders talk about. Once that fuel is used up, there may be no forced sellers left, and price can reverse sharply. This is the same “sweep and reclaim” shape described in our guide to stop-loss hunting.
Often, though, price reaches a band and very little happens. That is not a malfunction; it usually means the band was never as large as drawn.
Where the map is wrong
- Traders add margin or reduce size. A position’s liquidation price moves whenever its owner adds collateral or partially closes. The map cannot see this.
- Cross margin hides the true level. On cross margin, the liquidation price depends on the entire account, not just the position.
- Hedged and delta-neutral positions. A short future hedged with spot coins is not in real danger at its “liquidation price”; the trader will add margin. Basis and carry traders run these positions deliberately.
- Mark price, not last price, triggers liquidation. Exchanges commonly liquidate on mark price, so a wick on one venue’s last-price chart through a band may not have liquidated anything. See mark price vs. last price vs. index price.
- Coverage gaps. Venues not included in the provider’s data contribute nothing to the map, however large they are.
- Leverage assumptions. As the table showed, a different leverage mix moves every band.
Mistakes that cost traders money
- Treating a band as a price target. “Price must go to the yellow line” is a prediction the map cannot support.
- Putting your own stop just inside a band. If the band is real, that is where the cascade is fastest and slippage is worst. If you use a stop near one, size for a worse fill.
- Using a single screenshot. Bands appear and fade as positions open and close. A snapshot from yesterday morning says little about now.
- Ignoring your own liquidation price. The most important liquidation level on any chart is yours. Keep it far beyond your stop by sizing the position from the stop distance, not from the leverage slider.
How to test whether heatmaps help you
You can check the map’s usefulness with a simple log over a few weeks:
- Once per day at a fixed time, record the nearest band above and below price, its distance in percent, and your relative-brightness rating (for example 1 to 3).
- Over the next 24 hours, record whether price touched each band and what happened within the following hour: continuation through the band, reversal, or nothing notable.
- Pull actual liquidation totals for the same window from the provider’s liquidation history page and note whether a touch coincided with a liquidation spike.
- After 20 to 30 entries, compare: did touches of bright bands come with more realized liquidations than touches of faint ones? Did reversals happen more often than continuations?
A simple spreadsheet works well for this. If the log shows no difference between bright and faint bands, you have learned something valuable about how much weight to give the map.
Financial disclaimer: This article is for educational purposes only and is not financial, investment, or trading advice. Trading involves substantial risk of loss. Example figures are illustrative.