
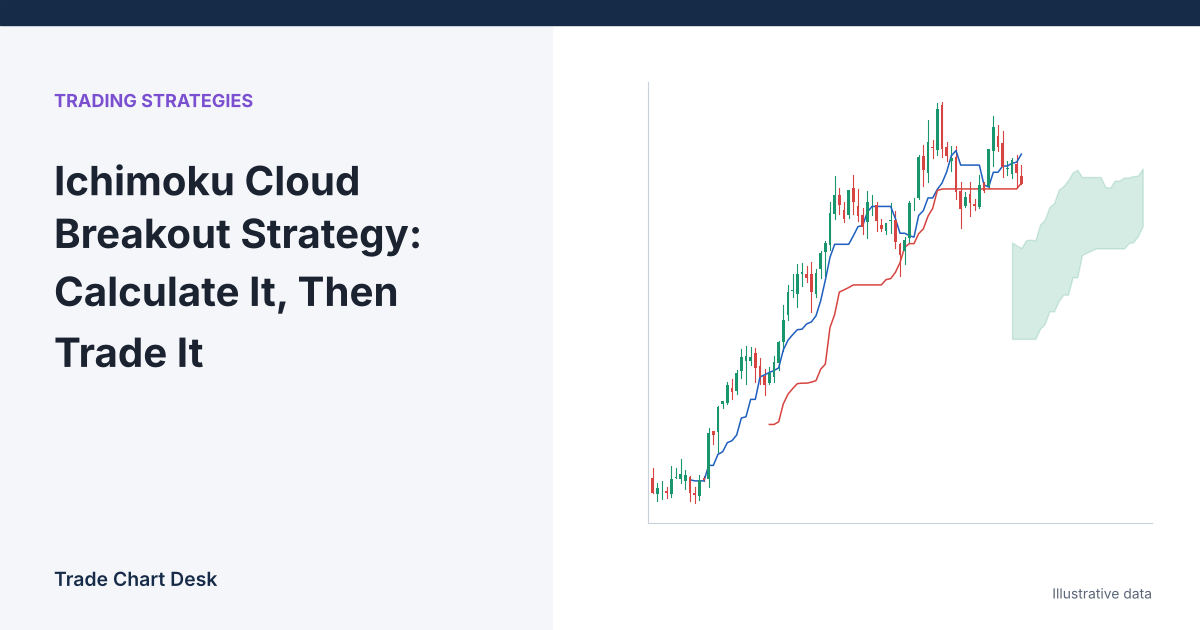
Most Ichimoku tutorials start with five Japanese names and a colored chart. This one starts with arithmetic, because once you have calculated the cloud by hand, the breakout rules stop being mysterious. You will see exactly why the cloud lags, why a “breakout” through a thin cloud means less than one through a thick cloud, and which settings to check on your platform before you test anything.
Calculate one bar of Ichimoku by hand
Every Ichimoku line except one is a midpoint: (highest high + lowest low) ÷ 2 over some lookback. The standard settings are 9, 26 and 52 periods, with a forward displacement of 26. TradingView’s Ichimoku Cloud reference describes the same structure: leading spans plotted 26 periods ahead and the lagging span plotted 26 periods back.
Illustrative daily BTC data for the current bar:
| Line | Inputs | Calculation | Value |
|---|---|---|---|
| Conversion line (Tenkan-sen) | 9-bar high $64,800, low $61,200 | (64,800 + 61,200) ÷ 2 | $63,000 |
| Base line (Kijun-sen) | 26-bar high $66,000, low $58,400 | (66,000 + 58,400) ÷ 2 | $62,200 |
| Leading Span A (Senkou A) | Conversion and base line | (63,000 + 62,200) ÷ 2 | $62,600, plotted 26 bars ahead |
| Leading Span B (Senkou B) | 52-bar high $71,000, low $55,000 | (71,000 + 55,000) ÷ 2 | $63,000, plotted 26 bars ahead |
| Lagging Span (Chikou) | Today’s close | No calculation | Plotted 26 bars back |
Two things follow directly from the table.
- The cloud under today’s candle is old. The two spans you calculate today are drawn 26 bars into the future. So the cloud sitting under the current candle was calculated from data that ended roughly 26 bars ago. A “cloud breakout” is price crossing a band built from last month’s ranges (on a daily chart).
- Span B is a 52-bar range midpoint. A single extreme wick from up to 52 bars ago can hold Span B in place for weeks. Flat stretches in the cloud’s edge are usually one old high or low that has not yet dropped out of the window.
The 26 vs. 25 detail
Platforms do not all count displacement the same way. Some count the current bar as bar one, so a “26” setting shifts lines 25 bars on the chart; others shift 26. Neither is wrong, but if you compare signals across two platforms, or code your own backtest, a one-bar mismatch will change entry dates. Check it: put a vertical line on any bar, find where that bar’s Span A value appears, and count.
What a cloud breakout actually is
A bullish cloud breakout, in its plain form, is a candle closing above the upper edge of the cloud (the higher of Span A and Span B at that bar) after closing inside or below it. The bearish version is the mirror image. The traditional confirmations people add are:
- The future cloud (26 bars ahead) is bullish, meaning Span A is above Span B.
- The conversion line is above the base line.
- The lagging span is above the price from 26 bars ago, so it is not running into old price action.
Each condition is a different lookback summarizing the same thing: recent highs and lows have shifted upward. They are not independent confirmations. When all three line up, you mostly know that price has already risen for a while.
A decision checklist with numbers
Continuing the illustration: at the current bar, the cloud has Span A at $63,400 and Span B at $61,900 (calculated 26 bars ago). Price closes at $64,100.
- Is the close above the cloud top? Top = $63,400. Close is $700 above it, about 1.1% of price. Yes.
- How thick is the cloud? $63,400 − $61,900 = $1,500, about 2.4% of the cloud top. Write this number down. A breakout through a cloud that is 0.3% thick is barely an event; a breakout through a thick cloud means price cleared a wide band of prior two-sided trading.
- Is the base line below price? Base line is $62,200, below the $64,100 close. Many traders use it as the initial invalidation level, since a close back below it means price has fallen below the midpoint of the last 26 bars.
- Where is the stop and what is the size? Stop just below the base line at $62,100. Risk = $64,100 − $62,100 = $2,000 per BTC. With a $10,000 account risking 1% ($100): size = $100 ÷ $2,000 = 0.05 BTC, about $3,205 of notional exposure. Our position sizing guide covers the formula.
- Exit rule? Decide before entry. Common choices: a close below the base line, a close back inside the cloud, or a trailing stop. See our trailing stop comparison for the trade-offs.
What changes if…
…the cloud is very thin?
A thin cloud means Span A and Span B were close together 26 bars ago, usually because the market was ranging. Breakouts through thin clouds are frequent and cheap to reverse. Some traders require a minimum thickness, for example 1 ATR, before counting a breakout. That filter cuts trades; it does not guarantee better ones.
…the stop is too wide for the account?
If the base line sits $5,000 below price, the same $100 risk gives a position of only 0.02 BTC. That is the honest result, not a reason to move the stop closer. If the size feels too small to bother with, skip the trade.
…you change the settings?
The 9/26/52 defaults date from a time when markets did not trade seven days a week, and some crypto traders lengthen them (for example doubling every input). Changing settings changes every line, every cloud and every past signal. Pick one set, write it down, and test that set. Switching after a losing streak is curve-fitting.
…you use a lower timeframe?
On a 15-minute chart, “26 bars ahead” is six and a half hours. The cloud there reflects very recent noise. Fees and slippage also take a much larger share of each trade.
Where cloud breakouts fail
- Range markets. Price oscillates through a thin cloud, generating signals in both directions. Like other trend-following rules, this is where losses cluster; see our comparison of trend following vs. mean reversion.
- Late entries. Because the cloud is built from old ranges, a breakout can trigger after most of a move is done. The entry above is $1,900 above the base line before the trade even starts.
- Intrabar signals. Price can poke above the cloud and close back inside. Only closed candles count.
- Data differences. Different exchanges print different highs and lows, so cloud edges differ across venues. A breakout on one exchange may not be a breakout on another.
Test it before you trust it
- Add the built-in Ichimoku indicator in TradingView and confirm the inputs (9, 26, 52, 26) and the displacement count described above.
- Pick one market and one timeframe, for example BTC/USDT daily on one exchange.
- Scroll back and, moving forward bar by bar with Bar Replay, log every close above the cloud top: date, close, cloud thickness in % and in ATR, base line, and the result in R (profit or loss divided by initial risk) under your exit rule.
- Split the results by cloud thickness. If thin-cloud breakouts and thick-cloud breakouts behave the same in your sample, the thickness filter is not doing anything.
- Include fees and slippage. Then look at the longest losing streak, not just the average.
Financial disclaimer: This article is for educational purposes only and is not financial, investment, or trading advice. Trading involves substantial risk of loss. Example figures are illustrative.