
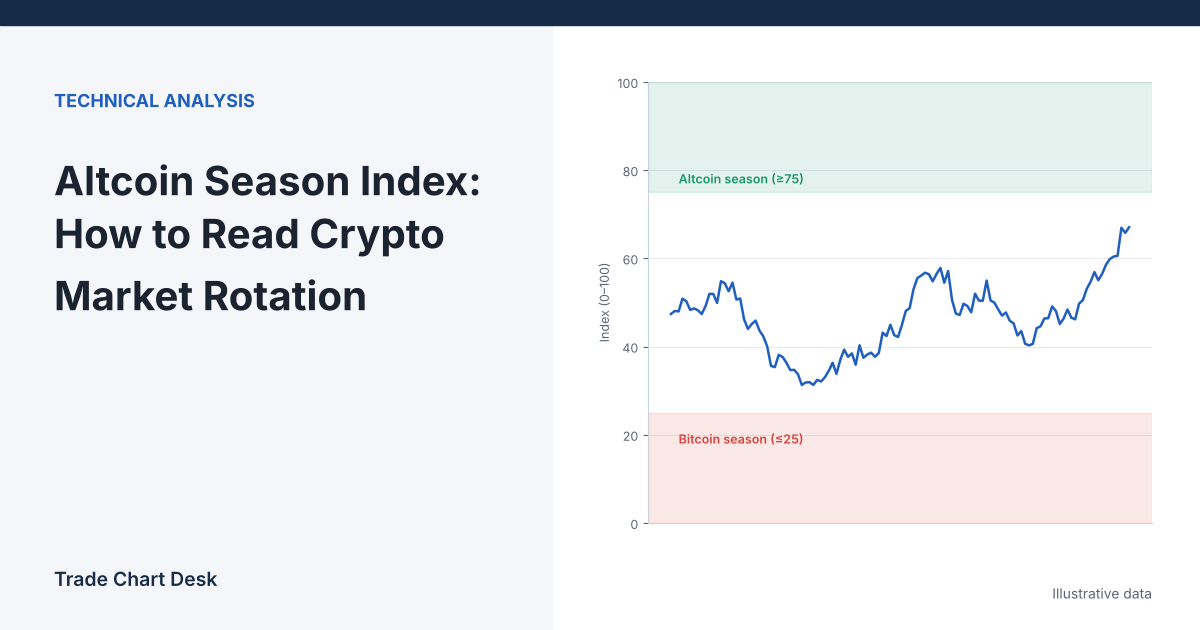
A common belief about the Altcoin Season Index is that a high reading means altcoins are making big gains. It does not measure that. It counts how many large coins beat bitcoin over the last 90 days. A reading can rise while most altcoins are losing money, and it can stay low during a period when a few altcoins have huge runs. Once you see how the count works, the index becomes a useful breadth gauge rather than a timing signal, and you can rebuild it yourself in a spreadsheet.
Two versions of the same idea
The index was popularized by Blockchain Center (blockchaincenter.net), and CoinMarketCap later published its own version. Both use a 90-day window and the same 75% / 25% thresholds, but they differ in the coin universe:
| Blockchain Center | CoinMarketCap | |
|---|---|---|
| Coins compared | Top 50 by market cap | Top 100 by market cap, ranked at the end of each day |
| Excluded | Stablecoins and asset-backed tokens (as commonly described) | Stablecoins and asset-backed or wrapped tokens (e.g. WBTC, stETH); ETH is included |
| Window | 90 days | Rolling 90 days |
| “Altcoin season” | 75% of coins beat BTC | 75% or more beat BTC |
| “Bitcoin season” | 25% or fewer beat BTC | 25% or fewer beat BTC |
CoinMarketCap documents its rules on its Altcoin Season Index page. Coverage of Blockchain Center’s version, such as this Cointelegraph summary, describes it as 75% of the top 50 assets outperforming bitcoin over 90 days. Because the universes differ, the two indexes can disagree on the same day, and that disagreement is information in itself (more on that below).
Build a mini index by hand
The clearest way to understand the index is to compute a small one. Take an imaginary top-10 altcoin list and a 90-day window in which bitcoin returned +10%. All returns are illustrative.
| Coin | Basket A, 90-day return | Basket B, 90-day return |
|---|---|---|
| 1 | +45% | +11% |
| 2 | +22% | +11% |
| 3 | +14% | +10.5% |
| 4 | +12% | +12% |
| 5 | +11% | +11.5% |
| 6 | +9% | +10.8% |
| 7 | +4% | −20% |
| 8 | −3% | −25% |
| 9 | −8% | −30% |
| 10 | −15% | −40% |
| Coins beating BTC (+10%) | 5 of 10 = 50 | 6 of 10 = 60 |
| Simple average return | +9.1% | −4.8% |
Basket B scores higher on the index even though its average coin lost 4.8% and four coins fell 20% or more. Basket A has a +45% winner and a positive average, but scores lower. The index only asks “did this coin beat bitcoin, yes or no?” A coin that beat bitcoin by 0.5 percentage points counts the same as one that beat it by 35.
Now change one input. If bitcoin had returned +12% instead of +10%, Basket A’s count drops from 5 to 3 (only the +45%, +22% and +14% coins still beat it). Nothing about the altcoins changed. Because the index is relative, a bitcoin rally can push it down and a bitcoin drop can push it up.
On a real 50-coin index, “75% outperformed” means at least 38 coins (75% of 50 is 37.5), and “25% or fewer” means 12 coins or fewer.
What the index is good for
- Breadth. It tells you whether outperformance against bitcoin is narrow (a few names) or broad (most of the large caps). That is useful context for portfolio rebalancing decisions between BTC and a basket of altcoins.
- Regime description. A long stretch in the low range describes a bitcoin-led market. That can help you decide whether altcoin breakouts deserve more skepticism right now, similar to how you would use any market regime filter.
- Comparing the two versions. If the top-50 index is high and the top-100 index is much lower, outperformance is concentrated in larger coins. If the reverse holds, smaller caps are doing the work.
Where the index misleads
A 90-day window is slow by design
Each day the index adds one new day of returns and drops one from three months ago. By the time 75% of coins have beaten bitcoin over a full 90 days, much of the move that produced the reading has already happened. The index describes the last quarter; it does not announce the next one.
Thresholds create false precision
The difference between a reading of 74 and 76 is one coin on a 50-coin list. Labels like “altcoin season” switch on and off on tiny changes. Read the trend of the line, not the label.
Composition changes underneath you
The top 50 or 100 is re-ranked as market caps move. Coins that crash fall out of the list and are replaced by coins that rallied into it. That survivorship tilts the index toward recent winners over time.
Price-only, no liquidity weighting
A thinly traded coin ranked 48th counts as much as ETH. The index says nothing about whether you could actually trade the coins that drove it.
It is not the same as dominance
Bitcoin dominance measures bitcoin’s share of total crypto market cap, which is dominated by the largest coins and affected by stablecoin supply. The Altcoin Season Index counts coins equally. The two often move together but can diverge; our guide to the stablecoin dominance ratio explains why stablecoin growth alone can shift dominance figures.
Rebuild it yourself to see what is driving it
A published index gives you one number. A home-made version tells you why the number moved.
- Pick a universe and freeze the rules. For example: the top 30 coins by market cap today, excluding stablecoins, wrapped tokens and liquid staking tokens. Write the list down.
- Download 90-day closes for each coin and for BTC from one source, all in USD at the same daily close time.
- Compute each coin’s 90-day return: close today ÷ close 90 days ago − 1. Do the same for BTC.
- Count and divide. Number of coins with return above BTC ÷ number of coins × 100.
- Add two extra columns the official index does not show: the median excess return (coin return minus BTC return) and the share of coins beating BTC by more than 10 percentage points.
The extra columns fix the main blind spot from the mini example. A score of 60 with a median excess of +1 percentage point is narrow, marginal outperformance. A score of 60 with a median excess of +15 points is a much stronger rotation. Recompute weekly and keep the results in your trading journal, so you can see how the readings looked before past rotations rather than relying on memory.
Questions readers usually ask
Does a reading above 75 mean I should buy altcoins?
No. It means most large altcoins already beat bitcoin over the past three months. Whether that continues is a separate question the index does not answer.
Why does my index site show a different number from another site?
Different universe (50 vs 100 coins), different exclusions, different data source and close time. Compare each index only with its own history.
Can I use a shorter window?
Yes, in your own version. A 30-day window reacts faster and flips more often. Whichever you use, set it before testing and do not keep adjusting it to fit past charts.
Financial disclaimer: This article is for educational purposes only and is not financial, investment, or trading advice. Trading involves substantial risk of loss. Example figures are illustrative.
1 thought on “Altcoin Season Index: How to Read Crypto Market Rotation”