
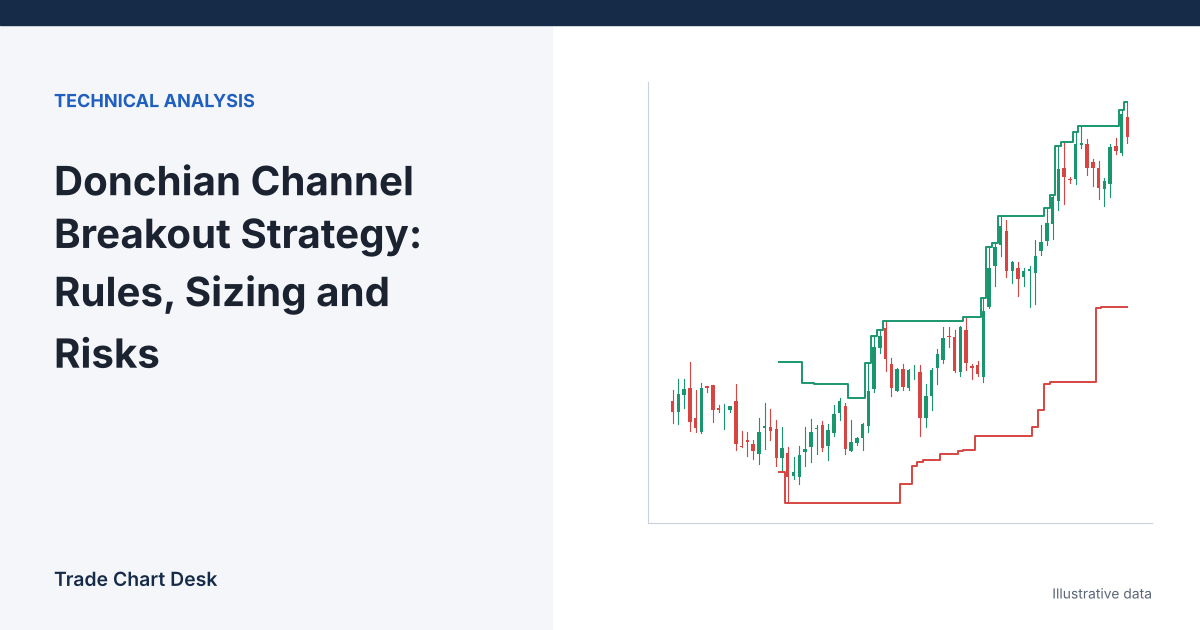
The Donchian channel is the simplest indicator on most charting platforms: the highest high and the lowest low of the last N bars, with a line halfway between them. It has no smoothing and no formula to argue about. Yet the breakout systems built on it are among the most studied rule sets in trading, because a complete set of them was eventually published. This article covers what the channel is, the history behind the 20- and 55-bar numbers, how those rules translate (and do not translate) to a market that trades 24/7, and how the classic sizing method works with a full worked example.
Donchian rules enter on the break itself and accept that many trades will fail quickly. If you prefer to wait for confirmation, the breakout and retest strategy walks through that alternative, and the guide to volume confirmation shows how to judge whether a breakout bar was actually unusual.
The channel in one minute
- Upper band = highest high of the last N bars
- Lower band = lowest low of the last N bars
- Middle line = (upper + lower) ÷ 2
StockCharts documents this under the name Price Channels, with a default of 20 periods, and notes that the indicator was developed by Richard Donchian.
The detail that breaks most beginner backtests
Platforms disagree about whether the current bar is included in the window. StockCharts’ version excludes it: a 20-day channel for October 21 is built from the 20 days ending October 20. TradingView’s built-in Donchian Channels includes the current bar, which means price can never close above the upper band, because the current high is part of the band. If you code “buy when close is above the upper band” on a channel that includes the current bar, it will never trigger. The correct test is “close (or high) is above the previous bar’s upper band.” Check which version you are looking at before you trust any signal you see on the chart.
Where the numbers come from
Richard Donchian is often called the father of trend following. CME Group’s education material credits him with starting Futures, Inc. in 1949, described as the first publicly managed futures fund. The rule most associated with his name is the “four-week rule”: go long when price exceeds the highs of the previous four calendar weeks, and exit or reverse when it falls below the lows of the previous four weeks. Four weeks of futures trading is roughly 20 trading days, which is where the familiar 20-bar default comes from.
The rules became famous through the Turtle traders. In 1983, commodity trader Richard Dennis and his partner Bill Eckhardt disagreed about whether trading could be taught, and Dennis recruited and trained a group of novices to find out. One of those trainees later published the full rule set free of charge; it is hosted by Trading Blox as The Original Turtle Trading Rules, and another original Turtle, Curtis Faith, described the system in his book Way of the Turtle (McGraw-Hill, 2007). As those rules are widely summarised:
| Rule | System 1 | System 2 |
|---|---|---|
| Entry | Break of the 20-day high (long) or low (short) | Break of the 55-day high or low |
| Skip filter | Skip the signal if the previous System 1 breakout would have been a winner | None: take every breakout |
| Exit | Break of the 10-day low (for longs) | Break of the 20-day low (for longs) |
| Stop | 2N from entry, where N is a 20-day average of true range | |
| Size | One unit = position where a 1N move equals 1% of account equity | |
| Adding | Add one unit every ½N in your favour, up to 4 units | |
Two points matter for anyone borrowing these rules. First, they were designed for a diversified portfolio of futures markets, where a big trend in one market paid for many small losses in others. Second, the edge came from a handful of large trends, not from a high win rate. A Donchian breakout system applied to one coin inherits the losses without the diversification.
Translating the rules to a 24/7 market
Crypto trades every day of the year. That quietly changes what “20 days” means.
| Original idea | In trading days | Same calendar span on daily crypto bars |
|---|---|---|
| Donchian’s four weeks | about 20 | 28 bars |
| Turtle System 2 entry | 55 (about 11 weeks) | 77 bars |
| Turtle System 1 exit | 10 (two weeks) | 14 bars |
A 20-bar channel on daily BTC covers less than three weeks of calendar time, not four. Neither choice is “correct”. If you are trying to reproduce the spirit of the original rules, the calendar span is the closer match. If you simply want a 20-bar channel, that is fine too. What matters is that you choose deliberately and do not later compare your results with claims made about the 20-day futures version.
A full trade, sized the Turtle way
Illustrative numbers only, on daily BTC/USD.
- Account equity: $20,000
- N (20-day average true range): $1,900
- Previous bar’s 20-day upper band: 64,800. Price trades through it and the entry fills at 64,850.
Unit size
The rule sets one unit so that a 1N move equals 1% of equity. For BTC quoted in dollars, one dollar of price move equals one dollar per BTC held, so:
Unit = (1% × equity) ÷ N = $200 ÷ $1,900 ≈ 0.105 BTC
With a 2N stop, the initial risk is 2 × $1,900 × 0.105 ≈ $400, which is 2% of equity. Many readers assume the Turtle rules risked 1% per trade; the 1% figure sets the unit, and the 2N stop makes the risk per unit about 2%.
Adding units
| Unit | Entry (each ½N = 950 higher) | Stop for all units (2N below latest entry) |
|---|---|---|
| 1 | 64,850 | 61,050 |
| 2 | 65,800 | 62,000 |
| 3 | 66,750 | 62,950 |
| 4 | 67,700 | 63,900 |
If all four units are filled and price then falls to 63,900, the combined loss is about $1,000 (5% of equity), even though the first unit is still in profit. The full position is roughly 0.42 BTC, worth about $27,900 at the average entry, which is more than the account. On a spot account without leverage you cannot take the full pyramid at this volatility; on a futures account you can, but you are now using leverage and must check that your liquidation price sits well beyond the stop. Our guides to position sizing and cross vs. isolated margin cover those two checks.
Exit
Under System 1 the trade is closed on a break of the 10-day low. If the trend carries price well above 67,700, the 10-day low will usually rise above the 63,900 stop and become the actual exit. Trailing exits like this give back a meaningful part of each move before they trigger; that is the price of staying in the trends that pay for everything else.
Key risks, specifically
- Whipsaw in ranges. In a sideways market, price touches the upper band, reverses, touches the lower band, and reverses again. A stop-and-reverse version loses on both sides. Breakout systems are trend tools; see trend following vs. mean reversion for how to tell which regime you are in.
- Long losing streaks. With a low win rate, ten or more losers in a row is a normal feature of the method, not a sign it is broken. At 2% risk per trade, ten consecutive losses take roughly 18% off the account. Decide whether you can sit through that before you start.
- Gaps and slippage. Breakouts happen when many orders hit at once, so stop entries often fill worse than the band. On thinner altcoins this can eat a large share of a small N.
- Look-ahead bias. Testing with a channel that includes the current bar, or entering at the band price on a bar that only closed above it, produces results you could never have traded.
- One market instead of many. The original design spread risk across many uncorrelated futures. Most crypto assets are highly correlated with Bitcoin, so “diversifying” across ten coins may behave more like one large position.
Checking it yourself
- Download daily candles for one coin (exchanges such as Binance provide up to 1,000 candles per API request, and TradingView can export chart data on some plans).
- In a spreadsheet, compute the 20-bar and 10-bar highs and lows excluding the current row, plus true range and a 20-bar average of it for N.
- Flag a long entry when the high exceeds the previous row’s 20-bar high, and an exit when the low falls below the previous row’s 10-bar low. Record each trade in R.
- Run it twice: once with 20/10 bars and once with 28/14 bars. Then add a realistic cost per trade (fees plus slippage) and see how much of the result survives.
For the related volatility channel that uses a moving average and ATR instead of highs and lows, see our Keltner Channel guide.
Financial disclaimer: This article is for educational purposes only and is not financial, investment, or trading advice. Trading involves substantial risk of loss. Example figures are illustrative.
1 thought on “Donchian Channel Breakout Strategy: Rules, Sizing and Risks”