
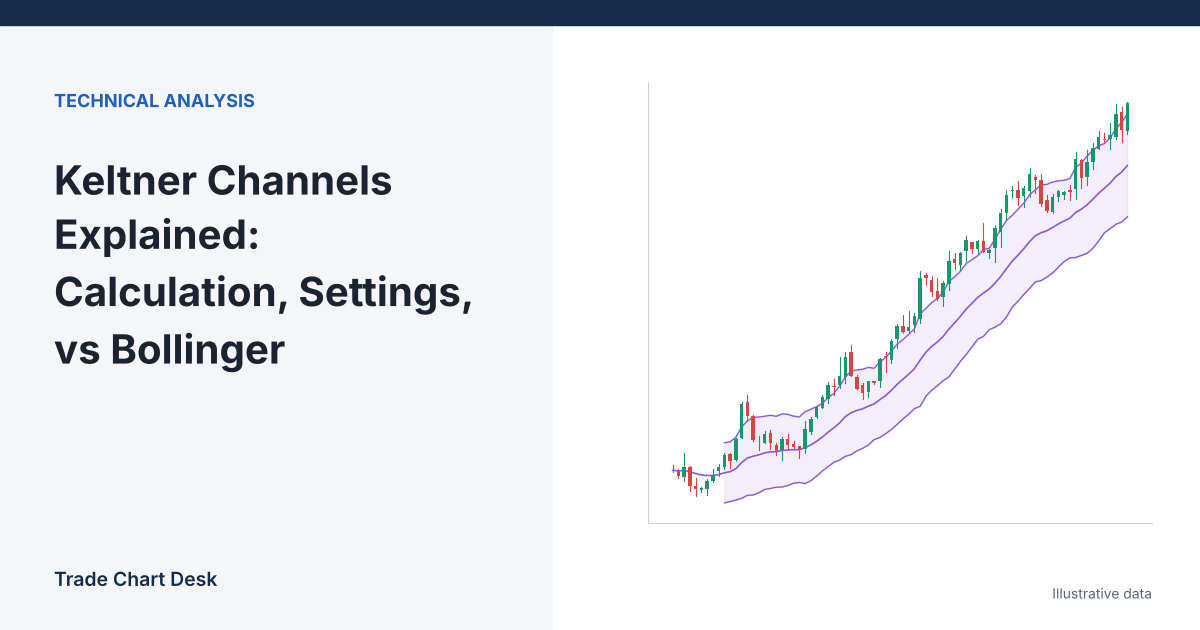
Put Keltner Channels and Bollinger Bands on the same chart and they often look almost identical: a middle line with an envelope above and below. Then a single large candle prints, and the two react completely differently. Bollinger Bands balloon outward; the Keltner Channel barely widens. That difference is the whole reason to know both, and it comes straight from the arithmetic. This guide calculates both indicators on the same candles, explains what each setting does, and shows how traders use the channel for breakouts and for pullbacks.
How the channel is built
The modern version, as documented by StockCharts ChartSchool, has three lines:
- Middle line = 20-period exponential moving average (EMA) of the close
- Upper channel = EMA + 2 × ATR(10)
- Lower channel = EMA − 2 × ATR(10)
ATR, the Average True Range, measures how far price typically travels in one bar, including gaps from the previous close. The ChartSchool settings are written as (20, 2, 10): EMA length, multiplier, ATR length. TradingView’s Keltner Channels use a default length of 20 and, as its Keltner Channels Strategy help page shows, let you choose a simple or exponential basis and switch the band width between ATR, plain true range and the high-low range. Always check the settings panel, because two charts labelled “Keltner” can be running different formulas.
A short history, because the old version still circulates
Chester Keltner described the original idea in his 1960 book How to Make Money in Commodities. His version used a 10-day simple moving average of the typical price, (high + low + close) ÷ 3, with bands set by the 10-day average of the high-low range. In the 1980s, Linda Bradford Raschke popularised the version above, with an EMA and ATR. Most charting software uses Raschke’s version, but some older tutorials and scripts still describe Keltner’s original. If someone’s rules mention “10-day typical price”, they are using the 1960 formula.
Same candles, two indicators
To see the difference, run both indicators through a simple illustrative scenario on BTC/USDT 4-hour candles.
The quiet period. For 20 bars, closes alternate between 59,800 and 60,200. Assume the 20-EMA sits at 60,000 and ATR(10) is 900 (the candles have normal wicks even though closes barely change).
- Bollinger (20, 2): standard deviation of the closes = 200, so bands at 59,600 and 60,400. Width: 800.
- Keltner (20, 2, 10): 60,000 ± 2 × 900, so channel at 58,200 and 61,800. Width: 3,600.
The Bollinger Bands are much tighter than the Keltner Channel here because closes are tightly bunched, while bar ranges are not. Bollinger only looks at closes; ATR looks at highs, lows and gaps.
The shock bar. The next candle has a high of 63,100, a low of 60,100, and closes at 62,500. The previous close was 60,200.
- True range = the largest of 63,100 − 60,100 = 3,000, |63,100 − 60,200| = 2,900, and |60,100 − 60,200| = 100. So TR = 3,000.
- New ATR(10), using Wilder’s smoothing (the standard ATR method): (9 × 900 + 3,000) ÷ 10 = 1,110.
- New EMA(20): the smoothing factor is 2 ÷ 21 ≈ 0.095, so 60,000 + 0.095 × (62,500 − 60,000) ≈ 60,238.
- Keltner channel: 60,238 ± 2 × 1,110 = 58,018 to 62,458. Width 4,440, up about 23%.
- Bollinger: the new 20 closes have a mean of 60,135 and a standard deviation of about 576, so bands at 58,982 to 61,288. Width about 2,306, nearly 2.9 times wider than before.
| Bollinger Bands (20, 2) | Keltner Channel (20, 2, 10) | |
|---|---|---|
| Middle line | Simple moving average | Exponential moving average |
| Width measures | Standard deviation of closes | Average true range (highs, lows, gaps) |
| Reaction to one big bar | Width jumps sharply (here ×2.9) | Width rises modestly (here ×1.23) |
| Close of 62,500 on the shock bar | About 1,200 above the upper band | Just 42 above the upper channel |
| Typical use | Volatility squeezes, mean reversion inside the bands | Trend channel, breakout and pullback reference |
The practical meaning: because Keltner width changes slowly, a close outside the channel represents a move that is large relative to recent bar ranges, and the channel does not instantly widen to “absorb” it. That steadiness is why ChartSchool describes Keltner as better suited to trend following. Bollinger’s quick expansion is what makes its squeeze readings useful, which our Bollinger Band squeeze tutorial covers in detail.
Using both together
The quiet period above is a textbook “Bollinger inside Keltner” condition: the Bollinger Bands (59,600 to 60,400) sit entirely inside the Keltner Channel. The TTM Squeeze, popularised by John Carter, defines a squeeze exactly this way, usually with Bollinger (20, 2) and a Keltner multiplier of 1.5. With 1.5 × 900 = 1,350, the Keltner band here would be 58,650 to 61,350, still well outside the Bollinger Bands. The squeeze “fires” when the Bollinger Bands expand back outside the channel.
What each setting actually changes
- Multiplier. The biggest lever. Halving it from 2 to 1 halves the channel’s width. A lower multiplier gives more closes outside the channel, so more signals and more false ones.
- ATR length. A shorter ATR (say 10) reacts faster to a new volatility regime; a longer one (20 or more) keeps width steadier. Our ATR guide explains Wilder’s smoothing.
- EMA length. Controls how quickly the middle line follows price. Shorter lengths keep the channel closer to current price; longer ones make it a slower trend reference.
- Timeframe. A 20-bar EMA on 1-hour candles covers less than a day; on daily candles it covers about three weeks in a 24/7 market. Change one thing at a time when you test.
Two ways traders use it
Breakout: a close outside the channel
The idea: a close above the upper channel means price has moved more than about two average bar ranges above its recent mean, which may indicate a new trend. In the example, the shock bar closed at 62,500, just above the upper channel at 62,458.
- Entry: 62,500. Stop: the middle line at 60,238. Risk per BTC: 2,262.
- With $100 risk (1% of $10,000): 100 ÷ 2,262 ≈ 0.044 BTC.
A single large bar makes the distance to the middle line wide, so the position becomes small. That is normal for channel breakouts: the bigger the breakout bar, the further away the logical stop. Compare with the Donchian channel breakout, which uses highest highs and lowest lows instead of a moving average and ATR.
Pullback: buying the middle line in an established trend
Once price has been walking along the upper channel and the EMA is rising, some traders wait for a pullback to the middle line rather than chasing a new high. Illustrative: EMA at 61,000, ATR 1,000, upper channel 63,000. Price dips to the EMA and a candle closes at 61,100.
- Stop: one ATR below the EMA, 60,000. Risk per BTC: 1,100.
- First target: the upper channel, 63,000. Reward per BTC: 1,900. Reward-to-risk ≈ 1.73.
- Size: 100 ÷ 1,100 ≈ 0.091 BTC.
Note that the target moves as the channel moves; this one is only a reference for whether the trade is worth taking.
Where Keltner Channels mislead
- Range-bound markets. When price chops sideways, closes outside the channel frequently reverse straight back. Breakout rules lose money repeatedly in these phases. Check whether the market is trending before applying a breakout rule.
- Lag after a regime change. Because ATR adapts slowly, after a sudden jump in volatility the channel is too narrow for several bars, producing a burst of “breakouts” that are really just the new normal range.
- Treating a touch as a reversal signal. In a strong trend price can ride the upper channel for a long time. Selling every touch of the upper line works only in ranges.
- Different formulas under one name. SMA versus EMA, ATR versus high-low range, and different defaults across platforms. Write down the exact settings you test.
Check it yourself
- On TradingView, add Keltner Channels (20, 2, ATR 10) and Bollinger Bands (20, 2) to a 4-hour BTC chart.
- Find a period where Bollinger Bands sat inside the Keltner Channel, and note what happened when they moved back outside.
- Find three large single candles and compare how much each indicator widened.
- For a test of the breakout rule, log every close outside the channel over several months: direction, distance to the middle line, and whether price reached 1R before hitting the stop. Our trading journal guide has a template.
Financial disclaimer: This article is for educational purposes only and is not financial, investment, or trading advice. Trading involves substantial risk of loss. Example figures are illustrative.
2 thoughts on “Keltner Channels Explained: Calculation, Settings, vs Bollinger”