
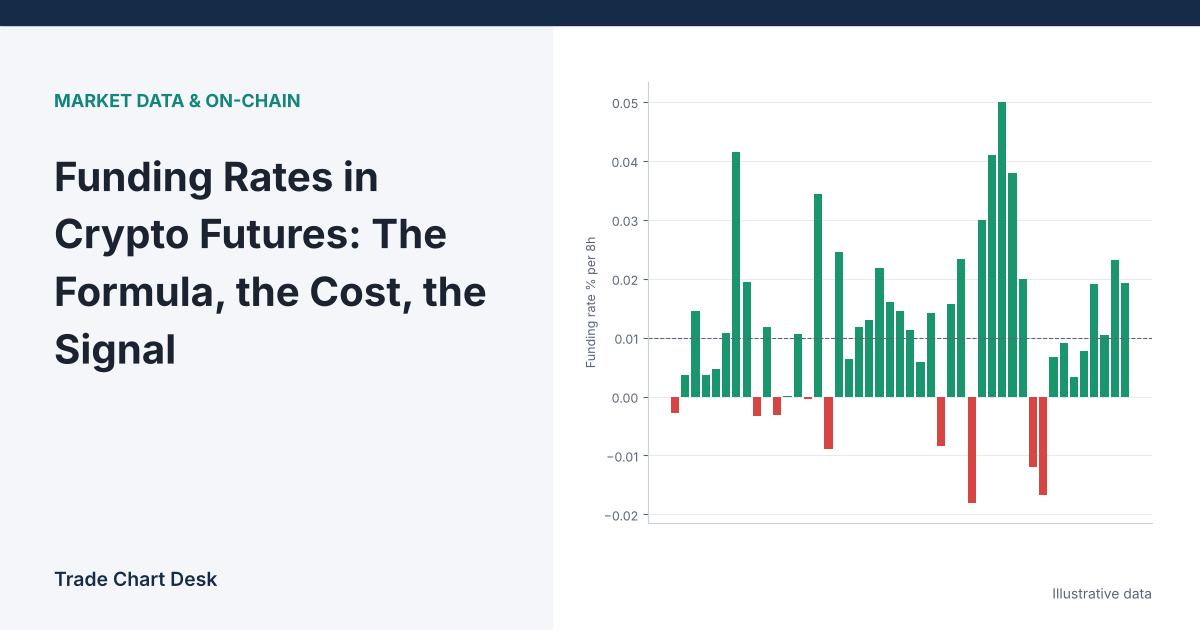
You open a $40,000 long on a BTC perpetual with $4,000 of margin. The funding rate shows 0.0100%. That looks like nothing. Hold the position for a month and you will have paid about $360, or 9% of your margin, before the trade has done anything. If the rate climbs to 0.0500% during a hot market, the same month costs $1,800. This article explains where that number comes from, how to calculate what it costs you, and what it can and cannot tell you about market positioning.
Why perpetual futures need funding at all
A normal futures contract has an expiry date, and on that date its price is forced to meet the spot price. A perpetual contract never expires, so it needs another mechanism to stop it drifting away from spot. That mechanism is funding: a periodic payment between long and short holders.
- Positive funding: longs pay shorts. This happens when the perpetual trades above the index (spot) price, which makes holding a long more expensive and pulls the price back down.
- Negative funding: shorts pay longs, for the opposite reason.
The exchange does not keep this money; it passes between traders. You only pay or receive funding if you hold a position at the exact settlement time. Close one second before and you neither pay nor receive.
The formula, using Bybit’s published version
Bybit documents its method in its funding rate help article. The core is:
Funding Rate = Premium Index + clamp(Interest Rate − Premium Index, +0.05%, −0.05%)
The result is then capped by an upper and lower limit that depends on the contract’s margin requirements. The pieces:
- Premium Index measures how far the perpetual’s order book is trading from the index price. It is sampled every minute and averaged over the funding period, with later minutes weighted more heavily.
- Interest Rate on Bybit is
0.03% ÷ (24 ÷ funding interval in hours). With an 8-hour interval that equals 0.01% per period; with a 4-hour interval it is 0.005%. - clamp means “keep the value inside this range.” Here it limits the interest adjustment to between −0.05% and +0.05%.
Binance uses the same structure with a default interest component of 0.03% per day (0.01% per 8 hours) for most contracts. Other venues use variations, so check your exchange’s contract specification page.
Why so many readings are exactly 0.0100%
Work the formula with a few illustrative premium values (8-hour interval, interest = 0.01%):
| Average premium | Interest − premium | After clamp | Funding rate |
|---|---|---|---|
| 0.030% | −0.020% | −0.020% | 0.010% |
| −0.020% | 0.030% | 0.030% | 0.010% |
| 0.080% | −0.070% | −0.050% | 0.030% |
| −0.100% | 0.110% | 0.050% | −0.050% |
Whenever the premium sits between −0.04% and +0.06%, the clamp absorbs the whole difference and the rate lands on exactly the interest rate, 0.01%. That is why a “neutral” market shows 0.0100% rather than zero, and why small changes in premium often do not show up in the rate at all. Funding only starts to move once the premium leaves that band.
Calculating what funding costs you
The payment is based on position value, not on your margin:
Funding payment = Position value × Funding rate
Using the opening example (illustrative numbers, 8-hour funding, three payments per day):
| Rate per period | Per payment on $40,000 | Per day | 30 days | 30 days as % of $4,000 margin |
|---|---|---|---|---|
| 0.0100% | $4 | $12 | $360 | 9% |
| 0.0500% | $20 | $60 | $1,800 | 45% |
At 10x leverage, a “small” rate becomes a large share of your capital. Annualized, 0.01% three times a day is about 11% of position value; 0.05% is about 55%. Rates rarely stay that high for a full year, but the comparison shows why funding matters for any trade you plan to hold for days or weeks. It also explains why leverage, not just direction, decides whether a trade is affordable. Our position sizing guide shows how to keep the position value tied to your planned risk.
What changes if…
…the contract settles every 4 hours instead of 8?
Some contracts settle more often. Binance moved a number of USDⓈ-M perpetuals to 4-hour settlement in October 2023, and Bybit’s article notes that settlement can switch to hourly when the rate hits its limit. The displayed rate is per period, so 0.01% every 4 hours costs twice as much per day as 0.01% every 8 hours. Always compare rates after converting to a daily figure: rate × (24 ÷ interval).
…you hold through settlement only by accident?
A scalp that happens to be open at 08:00 UTC pays the full period’s funding. If funding is high, check the countdown timer before entering short-term trades near settlement.
…you are short in a negative-funding market?
Then you pay. Heavily shorted coins can carry deeply negative funding for long stretches, which turns a bearish view into an expensive one to hold.
…you hedge with spot?
A long spot plus short perpetual position is roughly neutral to price and collects positive funding. It is not risk-free: the short leg can be liquidated in a sharp rally if it is under-margined, funding can flip negative, and fees eat into the return. Our article on spot vs. futures delta neutrality covers the mechanics.
Funding as a positioning signal
Because funding rises when traders are willing to pay a premium to be long, it is often used as a rough gauge of crowding. Reasonable readings:
- At the baseline (0.01% on 8h venues): no strong imbalance. This is the default state, not a bullish sign.
- Well above baseline for several periods: longs are paying up. If price stalls, those longs are expensive to hold and may close, which can accelerate a pullback.
- Negative while price is falling: shorts are crowded. A sharp move up can force them to buy back.
- Price rising while funding stays near baseline: the move may be driven more by spot buying than by leveraged longs.
Funding is more informative next to open interest. High funding plus rising open interest means new leveraged longs are still arriving; high funding with falling open interest means positions are already being closed. See our guide to open interest spikes for how to read that combination.
Where funding misleads
- Crowded can stay crowded. Elevated funding can persist through a long uptrend. Shorting purely because funding is “too high” means paying into a trend while you wait.
- One exchange is not the market. Rates differ across venues and margin types (USDT vs. coin-margined). Use an aggregated or OI-weighted view, or compare at least two major venues.
- Displayed vs. settled rate. The rate on screen before settlement is a running estimate; the premium can change before the timestamp. Your actual payment uses the settled rate.
- Caps distort extremes. When the rate is pinned at its limit, it no longer shows how extreme the imbalance really is.
Check it yourself
- Open your exchange’s funding history for one contract and export or copy the last 90 settlements.
- Count how many were exactly at the baseline rate. This tells you how rarely funding carries information beyond “neutral.”
- Sum the rates for any 30-day window and multiply by a position value you might realistically hold. That is your real carrying cost.
- For the settlements well above baseline, note what price did over the next 24 to 72 hours. Log both outcomes, not just the reversals you remember.
Ten minutes with that history will tell you more about how funding behaves on your market than any rule of thumb. If you keep a trading journal, add a column for funding paid per trade so it stops hiding inside your P&L.
Financial disclaimer: This article is for educational purposes only and is not financial, investment, or trading advice. Trading involves substantial risk of loss. Example figures are illustrative.