
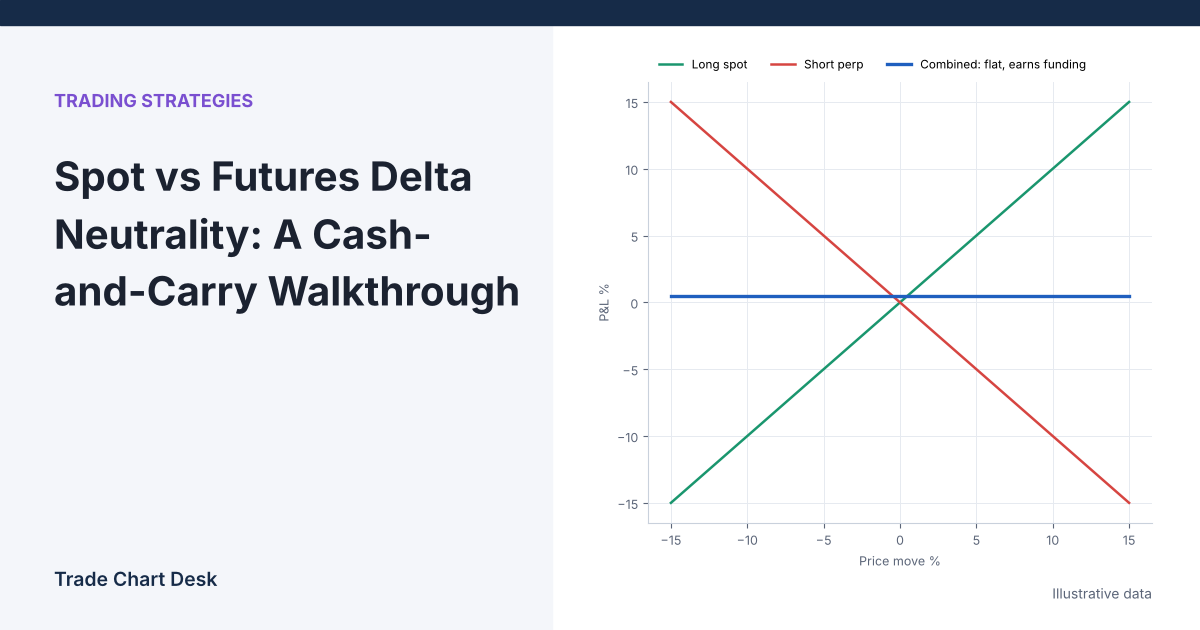
“Buy 1 BTC, short 1 BTC of futures, collect funding, no price risk.” That is how delta-neutral trading usually gets pitched. The first half is true: if the two legs are the same size, a move in Bitcoin’s price barely changes the combined value. The second half skips the parts that decide whether the trade makes money or blows up: what you actually earn, what you pay to get in and out, and what happens to the short leg when price rallies hard. This article builds one position step by step with illustrative numbers, then breaks it on purpose.
Delta in one paragraph
Delta is how much a position’s value changes for a $1 change in the underlying price. One BTC held in spot has a delta of +1 BTC: if Bitcoin rises $1,000, you gain $1,000. A short futures or perpetual position of 1 BTC has a delta of −1 BTC. Add them and the net delta is roughly zero. You no longer have a view on direction. What remains is the spread between the two legs, which is where both the income and the risk come from.
Two versions of the same trade
| Spot + perpetual short | Spot + dated futures short (classic cash-and-carry) | |
|---|---|---|
| What you earn | Funding payments, while funding is positive | The basis (futures price minus spot), locked at entry |
| Is the income fixed? | No. Funding is reset every period and can turn negative | Yes, if held to expiry, because futures converge to spot |
| When it ends | Whenever you close it | At contract expiry (or earlier if you close) |
| Main ongoing risk | Funding flips; short-leg margin | Short-leg margin until expiry |
CME describes the dated-futures version in its OpenMarkets explainer on Bitcoin futures basis: buy spot, sell longer-dated futures, and the basis tends to converge toward zero at expiry. If you are new to funding, read our funding rates guide first; this article assumes you know who pays whom.
Worked example: spot plus perpetual
All figures are illustrative. Fees are set at 0.10% for spot and 0.05% for perpetual taker orders, which are in the range of typical base-tier rates; check your own exchange’s fee page.
Entry
- Buy 1 BTC spot at $80,000. Fee: $80.00.
- Short 1 BTC perpetual at $80,080 (a 0.10% premium to spot). Fee: $40.04.
- Short leg margin at 3x leverage: $80,080 ÷ 3 = $26,693.
- Total capital tied up: $80,000 + $26,693 = $106,693.
Income
Funding is paid on position value. At 0.01% per 8-hour period, each payment is $80,080 × 0.0001 = $8.01. That is $24.02 per day, or $720.72 over 30 days (90 payments), if the rate holds steady and positive the whole time. The same calculation is laid out in Bybit’s funding rate documentation, which uses a default interest component of 0.01% per 8 hours.
Costs and net result after 30 days
- Entry fees: $120.04. Exit fees (same rates, assuming similar prices): about $120.04. Round trip: $240.08.
- Net: $720.72 − $240.08 = $480.64.
- On $106,693 of capital, that is about 0.45% for the month, roughly 5.5% annualized at simple rates.
Fees consumed a third of the gross income. Hold for only ten days and the trade barely covers its own costs. Also note the $80 premium you sold at: if the perpetual is back at a 0% premium when you close, that gap is a small extra gain; if the premium has widened, it is a small extra loss. Entry and exit spreads matter as much as funding over short holding periods.
Worked example: spot plus dated futures
Now use a quarterly future instead. Spot is $80,000 and the 90-day future trades at $81,600.
- Basis: $81,600 − $80,000 = $1,600, or 2.0% of spot.
- Annualized at simple rates: 2.0% × (365 ÷ 90) ≈ 8.1%.
Hold both legs to expiry and the future settles near the spot price on that day, whatever it is. If BTC is at $60,000 at expiry, spot lost $20,000 and the short future gained $21,600. If BTC is at $100,000, spot gained $20,000 and the short lost $18,400. Either way the combined result is about +$1,600 before fees, because the basis collapsed to zero. Unlike funding, this number was known on day one.
The catch is that “hold to expiry” assumes the short leg survives every price path along the way.
Where it breaks: the short leg in a rally
Your spot BTC and your futures margin usually sit in different accounts or wallets. When price rises, spot gains value but the short loses margin. Unless the exchange counts your spot as collateral, those gains do not protect the short.
A simplified estimate for an isolated short (ignoring fees and using a 0.5% maintenance margin rate) is:
Liquidation price ≈ Entry × (1 + 1 ÷ Leverage − Maintenance margin rate)
| Short leverage | Margin posted | Approx. liquidation price | Rally needed |
|---|---|---|---|
| 3x | $26,693 | $106,373 | +32.8% |
| 10x | $8,008 | $87,688 | +9.5% |
A 9.5% move in Bitcoin is not unusual over a few days. At 10x, the short is liquidated, often at a worse price than the estimate, and you are left holding naked spot. You were “delta neutral” until the moment you suddenly were not, and the trade now has full price exposure plus a realized loss on the short. Exchanges use their own formulas with tiered maintenance rates, so use your exchange’s calculator for the real number. Our guide to cross vs isolated margin explains how the margin mode changes this, and liquidations trigger on mark price, covered in our price types explainer.
Other ways it goes wrong
- Funding turns negative. Same position, but suppose funding runs at +0.01% for 20 days and then −0.015% for 10 days. You receive $480.48, pay $360.36, net $120.12, and after $240.08 of fees you are down $119.96. Delta neutral and still losing.
- Legs on different venues. Holding spot on one exchange and the short on another doubles your counterparty risk. If one exchange halts withdrawals, you cannot move collateral to save the other leg.
- Size drift. On coin-margined (inverse) contracts, the dollar value of your margin changes with price, so 1 BTC of exposure on each side does not stay perfectly matched. Check net delta in dollars, not just coin counts.
- Exit slippage. Closing both legs in a fast market can cost more than the funding you earned. Unwind with limit orders when you can, and not at the moment of a spike.
- Stablecoin and platform risk. Margin in USDT or USDC carries issuer risk. “Neutral to BTC” is not neutral to everything.
A pre-trade checklist with numbers
- Expected income: average funding over the last 30 days (from the exchange’s funding history) × position value × payments per day × planned days. For dated futures: the basis, in dollars.
- Round-trip cost: four fills (open and close on each leg) at your actual fee tier, plus an estimate for spread.
- Breakeven days: round-trip cost ÷ expected daily income. In the example, $240.08 ÷ $24.02 ≈ 10 days.
- Liquidation distance: from your exchange’s calculator. Write down the price and the percentage rally needed.
- Top-up plan: how much reserve collateral you keep, and the price at which you add it or reduce size.
- Exit rule: for example, close if the 3-day average funding falls below the level that covers remaining fees.
Log each of these in your trading journal along with actual funding received, so you can compare what you expected with what the trade actually delivered.
Financial disclaimer: This article is for educational purposes only and is not financial, investment, or trading advice. Trading involves substantial risk of loss. Example figures are illustrative.
2 thoughts on “Spot vs Futures Delta Neutrality: A Cash-and-Carry Walkthrough”