
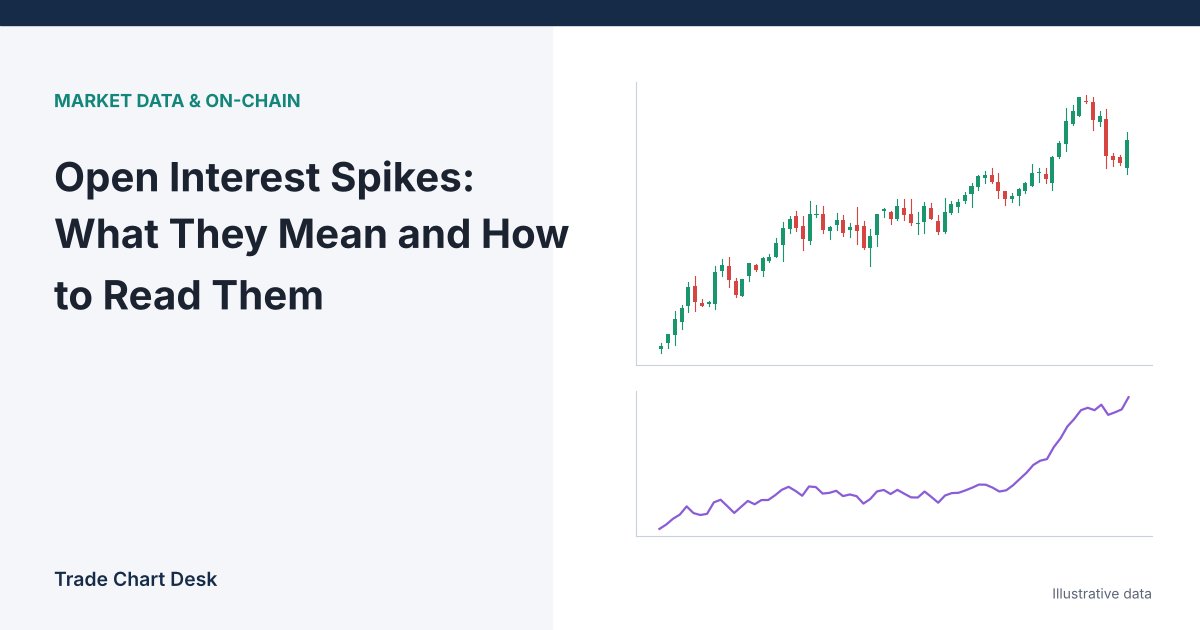
Your dashboard says Bitcoin futures open interest jumped 5% in a few hours. Did thousands of new traders just pile in? Maybe. Or maybe not a single new position was opened and the price simply went up 5%. Before you can read an open interest (OI) spike, you need to know which of those happened. This guide answers the questions traders most often have about OI, in the order they usually come up.
What exactly is open interest counting?
Open interest is the total number of derivative contracts that are still open, meaning they have not been closed, settled or liquidated. TradingView’s open interest reference uses that definition. Every open contract has one long side and one short side, so OI counts each contract once, not once per side.
CME’s lesson on open interest walks through how individual trades change it. In short:
| Buyer is… | Seller is… | Effect on OI |
|---|---|---|
| Opening a new long | Opening a new short | Rises |
| Opening a new long | Closing an old long | Unchanged (position changes hands) |
| Closing an old short | Opening a new short | Unchanged (position changes hands) |
| Closing an old short | Closing an old long | Falls |
This is the most important table in the article. It means OI cannot tell you whether the new money is “bullish” or “bearish.” Every new long has a new short on the other side.
How is OI different from volume?
Volume counts how many contracts traded during a period. OI counts how many remain open at a moment. A day can have enormous volume and flat OI if positions just changed hands, or modest volume and rising OI if most trades opened new positions. Volume is a flow; OI is a stock.
Is the spike in coins or in dollars?
This is where many OI readings go wrong. Data sites often show OI in US dollars, which is contracts (in coin terms) × price. So dollar OI moves with price even when no one opens or closes anything. Using illustrative numbers, start with 80,000 BTC of open interest at $90,000, or $7.2 billion. Price then rises 5% to $94,500:
| Scenario | OI in BTC | OI in USD | USD change | What really happened |
|---|---|---|---|---|
| A | 80,000 | $7.56B | +5.0% | Nothing opened or closed; price did all the work |
| B | 84,000 | $7.94B | +10.25% | New positions opened into the rally |
| C | 76,000 | $7.18B | −0.25% | Positions were closed (for example, shorts buying back) |
Scenario C is the trap. The USD chart looks almost flat, yet 4,000 BTC of positions disappeared, which is a meaningful event. Scenario A looks like a 5% “spike” with no new participation at all. Always switch the OI view to coin or contract terms, or divide USD OI by price yourself, before interpreting it.
So what does a real OI spike mean?
A genuine rise in coin-denominated OI means more leveraged exposure is open than before. It says leverage is building, not which side will win. The useful part comes from pairing it with price:
| Price | OI (coin terms) | Common reading | What could make it wrong |
|---|---|---|---|
| Up | Up | New positions are joining the move; aggressive buyers are opening longs against passive shorts | Large basis or hedging trades can add OI without any directional view |
| Up | Down | Short covering is driving the rally | Longs taking profit also reduce OI |
| Down | Up | New shorts are pressing the move | Longs “buying the dip” also add OI |
| Down | Down | Longs are closing or being liquidated | Shorts taking profit also reduce OI |
The right-hand column matters. Each row has at least two possible explanations, which is why OI works best as one input next to others, not as a signal on its own.
What should I check alongside an OI spike?
- Funding rate. If OI rises and funding climbs well above its baseline, longs are the side paying to stay in, which suggests long-heavy positioning. Our guide to funding rates explains the baseline and the formula.
- Spot vs. futures volume. A rally with rising futures OI but weak spot volume is more leverage-driven than one led by spot buying. Our article on volume confirmation covers how to compare them.
- Liquidation data. A sudden OI drop together with a spike in reported liquidations is forced closing, not voluntary profit-taking.
- Price location. OI building just under a well-watched resistance level is a different situation from OI building after a breakout has already held.
Why do large OI build-ups often end in sharp moves?
Leveraged positions have liquidation prices. The more leveraged exposure is open, the more forced orders exist just beyond current price. If price moves against the crowded side, liquidations become market orders in the same direction, which can push price into the next group. When the move is over, OI usually drops quickly. Liquidation heatmap providers estimate where those levels may be by combining OI changes with assumed leverage; our guide to liquidation heatmaps shows how that estimate is built and where it fails.
A build-up does not tell you when, or in which direction, that unwind will come. It only tells you that the market has more fuel for a fast move than before.
Which mistakes do traders make with OI?
- Reading USD OI as participation. Covered above; check coin terms first.
- Looking at one exchange. OI is fragmented across venues. A spike on one exchange can be traders moving from another. Use aggregated OI when you can.
- Mixing contract types. USDT-margined and coin-margined contracts behave differently when price moves, and options OI is a separate data series again.
- Calling every OI rise “bullish.” For every new long there is a new short. Rising OI means more leverage, not more buyers.
- Ignoring scheduled events. OI often rises into data releases such as CPI or a rate decision as traders position, then falls afterwards. That pattern says more about the calendar than about trend strength.
How can I test OI readings myself?
- On TradingView, add the Open Interest indicator to a BTC perpetual chart. TradingView provides intraday crypto OI for several major derivatives exchanges.
- Define a spike in writing before looking at results, for example: coin-denominated OI rises at least 3% within four hours.
- For each spike over the last few months, record the price direction during the spike, the funding rate at the time, and the price change over the next 24 hours.
- Sort the results into the four price/OI combinations from the table above and compare. Note how often each combination was followed by continuation and how often by reversal.
If your results show no clear difference between the groups on your market and timeframe, that is a valid finding. It tells you to use OI as context about leverage rather than as a trade trigger.
Financial disclaimer: This article is for educational purposes only and is not financial, investment, or trading advice. Trading involves substantial risk of loss. Example figures are illustrative.
2 thoughts on “Open Interest Spikes: What They Mean and How to Read Them”