
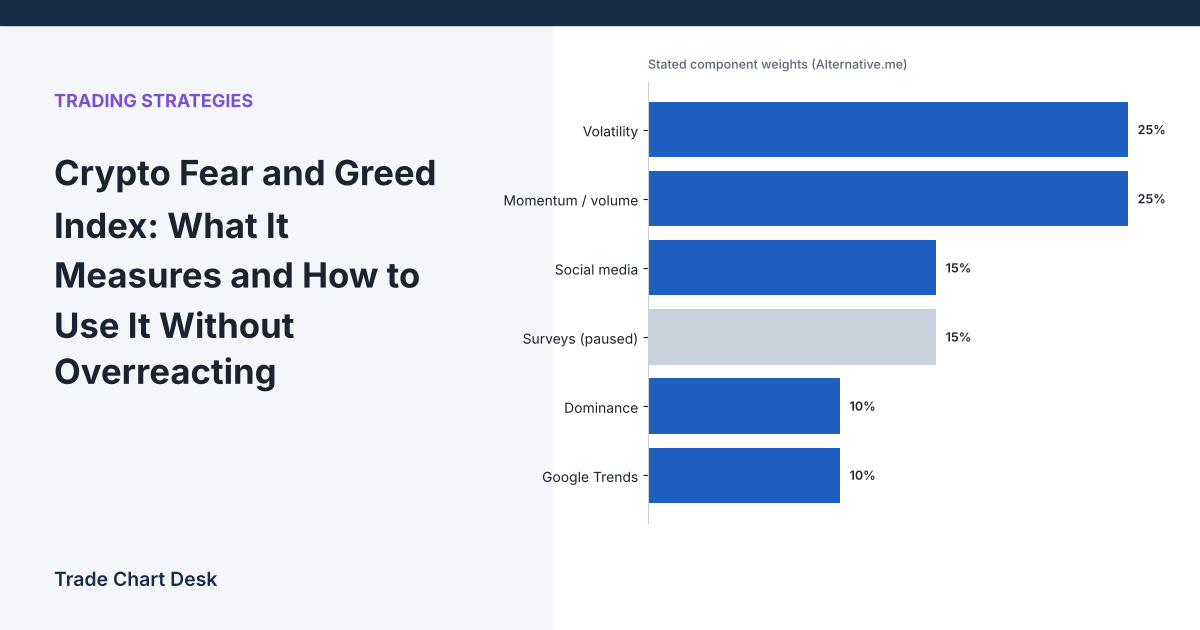
The Crypto Fear & Greed Index condenses market mood into one number from 0 (extreme fear) to 100 (extreme greed). It is popular because it is simple, and it is often misused for the same reason. Before using it in any decision, it helps to know exactly what goes into the number, what it cannot tell you, and how to check whether it adds anything to your own process.
Which index are we talking about?
Several “fear and greed” indices exist. CNN publishes one for the U.S. stock market, built from different inputs. This article covers the crypto index published by Alternative.me, which is the one most crypto traders mean. According to the provider, the current index focuses on Bitcoin, not on the crypto market as a whole. Using it to judge a small-cap altcoin is a stretch.
What goes into the number
Alternative.me lists the following components and weights on its methodology page (checked October 2026; the provider may change them):
| Component | Stated weight | What it looks at |
|---|---|---|
| Volatility | 25% | Current Bitcoin volatility and drawdowns compared with 30- and 90-day averages |
| Market momentum / volume | 25% | Current volume and momentum compared with 30- and 90-day averages |
| Social media | 15% | Activity and interaction rates on Bitcoin-related posts |
| Surveys | 15% | Weekly polls — listed as currently paused |
| Dominance | 10% | Bitcoin’s share of total crypto market cap |
| Google Trends | 10% | Changes in Bitcoin-related search queries |
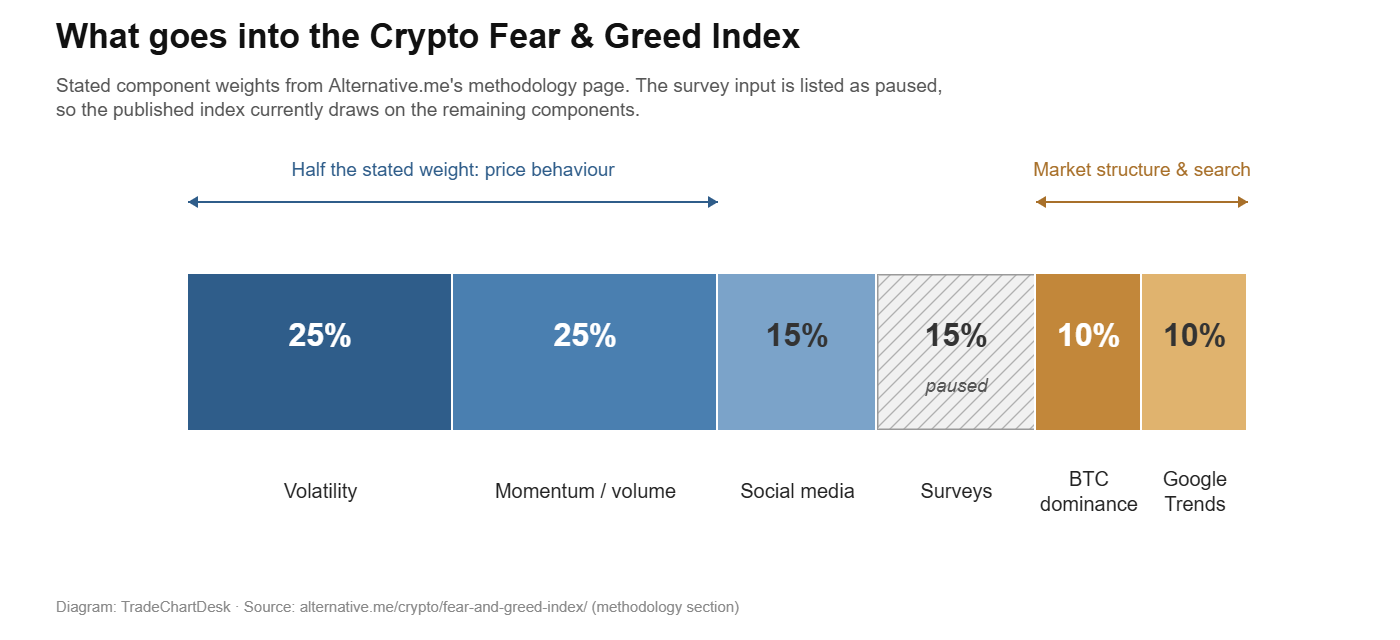
Two things stand out:
- Half the weight comes from price behavior itself (volatility and momentum/volume). A falling, volatile market will push the index toward fear almost automatically. That means the index partly describes what price has already done, rather than providing independent information about what price will do.
- With surveys paused, the listed weights no longer add up to 100%. The provider does not explain how the remaining components are rebalanced, so treat the exact weighting as uncertain.
The contrarian idea and its limits
The provider’s own framing is that extreme fear may indicate investors are too worried and extreme greed may indicate the market is due for a correction. That is a hypothesis, not a rule. Three problems come up in practice:
- Extremes can last. In a strong trend, the index can sit in “greed” or “fear” for weeks. Acting on the first extreme reading can mean entering far too early.
- Fear can be justified. A low reading after a genuine negative event (an exchange failure, a regulatory action) may reflect real deterioration, not overreaction.
- It is a daily number. The index updates once per day. It is not designed for intraday timing.
A worked example: what “buying fear” actually does to your average price
Suppose you decide to put $100 into Bitcoin each time the index closes below 20, and the following happens (illustrative prices, not historical data):
| Purchase | Price | Units bought |
|---|---|---|
| 1 | $100 | 1.000 |
| 2 | $80 | 1.250 |
| 3 | $60 | 1.667 |
| 4 | $80 | 1.250 |
Total spent: $400. Total units: 5.167. Average cost: about $77.42. At the final price of $80, the position is roughly 3% in profit, even though the first purchase is still 20% under water.
That looks reassuring, but it depends entirely on price recovering. If price had kept falling to $40 instead of returning to $80, every additional purchase would have increased the size of a losing position. Averaging down needs a predefined limit: a maximum total allocation and a number of purchases after which you stop, regardless of what the index says.
Note that this is not dollar-cost averaging in the usual sense. Dollar-cost averaging means investing a fixed amount on a fixed schedule regardless of conditions. Buying only on fear readings is a conditional strategy with different risks.
A practical way to use the index
Rather than a trading signal, the index works better as a prompt to check your own behavior:
- Before buying during extreme greed, ask: Would I take this trade if the chart looked the same but nobody was talking about it? Is my position size larger than my plan allows? Our piece on overcoming FOMO covers this pattern.
- Before selling during extreme fear, ask: Has my original reason for the position actually been invalidated, or am I reacting to the drop?
- Record the reading in your journal next to every trade. After a few months, you can check whether your worst decisions cluster at extreme readings. That is information specific to you, which is more useful than a general rule. Our trading journal guide explains how to set this up.
How to test the contrarian idea yourself
Alternative.me provides the full history through a free API. A request to https://api.alternative.me/fng/?limit=0&format=csv returns every daily reading in a format you can paste into a spreadsheet. The provider requires attribution if you display or publish the data.
With that data and a daily Bitcoin price series, you can check a simple question: after days when the index closed below a threshold, what happened to price over the next 30 days, compared with all other days? When you do this, keep three cautions in mind:
- The history is short relative to market cycles, so a handful of episodes can dominate the result.
- Readings that cluster on consecutive days are not independent observations.
- Choosing the threshold after seeing the results (for example, “below 12 worked best”) is curve-fitting.
Common mistakes
- Using the crypto index for stock decisions, or the stock index for crypto.
- Treating the index as a valuation measure. A low reading does not mean an asset is cheap.
- Shorting purely because the index shows greed, especially with leverage.
- Adding to a position indefinitely because fear persists.
The short version
- The Alternative.me index is Bitcoin-focused and half of its stated weight comes from price-derived inputs.
- Extreme readings can persist and can be justified; they are not timing signals.
- Its most reliable use is as a check on your own emotional decisions.
- Free historical data means you can test any claim about it yourself.
Data source and methodology: Alternative.me Crypto Fear & Greed Index. Financial disclaimer: This article is for educational purposes only and is not financial, investment, or trading advice. Trading involves substantial risk of loss. Example prices are illustrative.