
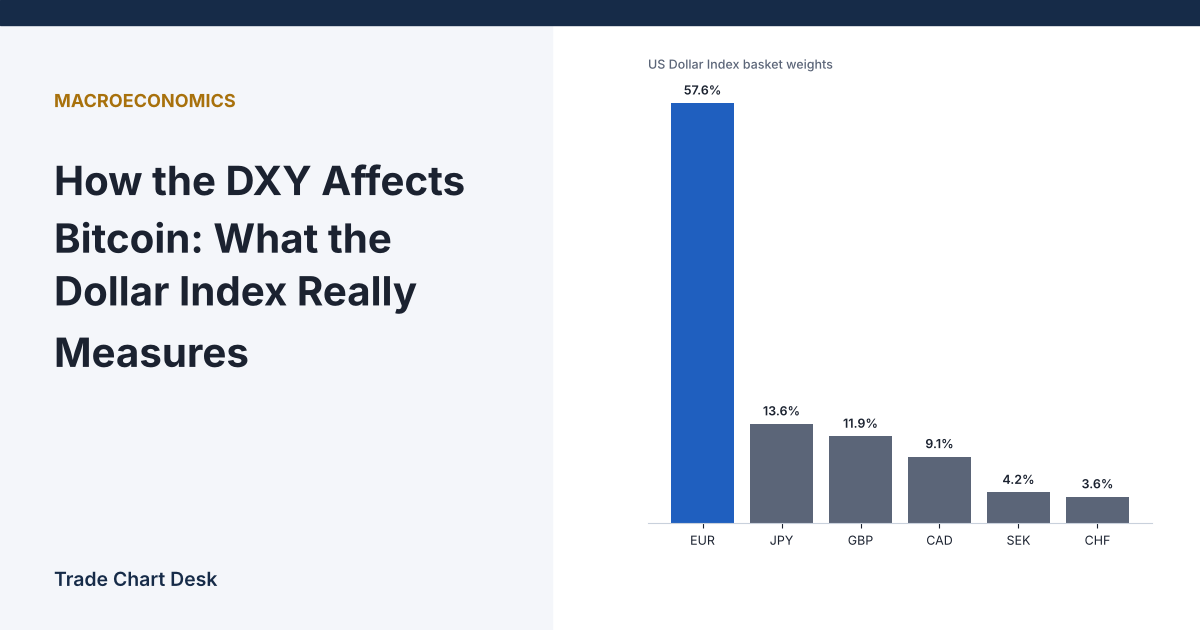
“Dollar down, bitcoin up” is one of the most repeated lines in crypto commentary. Before you add the DXY to your chart and start trading off it, it helps to know what the index actually is. It is not “the dollar.” It is the dollar against six currencies, and more than half of it is one exchange rate. That one fact explains most of the times the DXY seems to say one thing while bitcoin does another.
Open the basket first
The U.S. Dollar Index (ticker DXY, futures symbol DX) is maintained and published by Intercontinental Exchange (ICE). It started in March 1973 at a base value of 100, and its basket has changed only once, in 1999, when the euro replaced several European currencies. The six components and their fixed weights are:
| Currency | Weight |
|---|---|
| Euro (EUR) | 57.6% |
| Japanese yen (JPY) | 13.6% |
| British pound (GBP) | 11.9% |
| Canadian dollar (CAD) | 9.1% |
| Swedish krona (SEK) | 4.2% |
| Swiss franc (CHF) | 3.6% |
The index is a geometric average of those exchange rates:
DXY = 50.14348112 × EURUSD^-0.576 × USDJPY^0.136 × GBPUSD^-0.119 × USDCAD^0.091 × USDSEK^0.042 × USDCHF^0.036
The negative exponents appear where the pair is quoted with the dollar second (EUR/USD, GBP/USD), so a rise in those pairs means a weaker dollar. ICE describes the contract and its six components on its US Dollar Index futures page. The weights and formula above are the widely published ICE methodology.
Notice what is missing: the Chinese yuan, the Mexican peso, the Korean won, and every other emerging-market currency. The basket reflects US trade in 1973, not today.
Run the numbers: one pair drives the index
Because the index is a product of powers, each pair’s percentage change feeds through at roughly its weight. Using illustrative exchange rates (EUR/USD 1.1000, USD/JPY 150.00, GBP/USD 1.3000, USD/CAD 1.3800, USD/SEK 9.5000, USD/CHF 0.8000), the formula gives a DXY of about 102.11. Now change one pair at a time:
| Scenario (illustrative) | New DXY | DXY change |
|---|---|---|
| EUR/USD rises 1% (1.1000 to 1.1110) | 101.53 | -0.57% |
| USD/JPY falls 1% (150.00 to 148.50) | 101.97 | -0.14% |
| EUR/USD falls 0.5% and USD/JPY falls 2% (to 147.00) | 102.12 | +0.01% |
The last row is the important one. The dollar fell 2% against the yen, a large daily move for that pair, and rose 0.5% against the euro. The DXY barely moved. If yen strength was the macro story that day, the DXY hid it completely.
So when you see the DXY move, the first question is: was this the euro? Pull up EUR/USD next to it. Most of the time, you will find the answer there.
Why bitcoin and the dollar are linked at all
There is no mechanical connection between the DXY and bitcoin. The link people observe comes through a few indirect channels:
- Pricing unit. Bitcoin is mostly quoted in dollars or dollar stablecoins. A broadly weaker dollar can make dollar-priced assets look higher in dollar terms, all else equal.
- Financial conditions. A rising dollar often goes with higher US real yields or tighter global liquidity, conditions that have tended to weigh on speculative assets. Our article on how interest rates affect bitcoin covers that channel in more detail.
- Shared drivers. A US inflation surprise can move Treasury yields, the dollar and bitcoin at the same time. In that case the DXY is not causing the bitcoin move; both are reacting to the same news. See how US CPI releases move bitcoin.
Because the link is indirect, its strength changes. There are long stretches where crypto-specific events (ETF flows, regulation, exchange failures, leverage unwinds) dominate and the dollar is irrelevant to the day’s price action.
Misconceptions that cost traders money
“The DXY is a measure of the dollar’s global strength”
It is a measure against six developed-market currencies, mostly the euro. For a broader picture, the Federal Reserve publishes trade-weighted dollar indexes in its H.10 release, including a nominal broad index that covers many more trading partners. On FRED, the daily broad index is series DTWEXBGS. If the DXY and the broad index disagree, the difference is usually emerging-market or yuan moves.
“A negative correlation means I can trade bitcoin off the DXY”
A correlation coefficient describes how two series moved together over a window you chose. It says nothing about which moved first, and it can flip sign when the window changes. A 30-day correlation of -0.6 does not mean the next DXY move will be followed by an opposite bitcoin move.
“Correlate the price charts”
Correlating price levels of two trending series produces large numbers that mean very little: any two assets that both trended over a period will look correlated. Correlate daily percentage changes (returns) instead.
“The DXY reacts the same time bitcoin does”
Bitcoin trades 24/7. ICE lists DXY futures as trading about 21 hours a day from Sunday evening to Friday (US Eastern Time), with nothing on Saturday. A weekend bitcoin move has no matching DXY data until Sunday evening US time, so daily-bar correlations that mix weekends with Friday DXY values understate or distort the relationship.
Check the relationship yourself
You can measure the current link instead of trusting a headline:
- Get aligned data. Download daily closes for BTC/USD and for DXY (TradingView carries the index as TVC:DXY and the continuous futures as DX1!). Keep only weekdays where both have a close.
- Convert to returns. For each day, return = today’s close ÷ yesterday’s close – 1.
- Compute rolling correlations over two windows, for example 30 and 90 trading days, with a spreadsheet’s CORREL function or a correlation indicator in your charting tool set to the comparison symbol.
- Repeat with EUR/USD. If the BTC-EURUSD correlation looks almost like the BTC-DXY correlation with the sign flipped, you have confirmed that the “dollar signal” is mostly a euro signal.
- Plot the rolling value over time. Count how often it changes sign. A relationship that flips several times a year is context, not a trigger.
Using the DXY sensibly on a chart
A reasonable role for the DXY is as a filter for when to be more careful, not a signal to enter. An example rule, written so you can test it rather than as a recommendation:
- Only take a long breakout on bitcoin’s daily chart if DXY is not making a new 20-day high on the same day.
- Define the breakout and stop in advance, using the same method you would without the filter. Our guide on breakouts and false breakouts covers one approach.
- Log every signal with and without the filter. If the filter removes about as many winners as losers, it is adding complexity without information.
The filter will fail in at least two obvious ways: when crypto-specific news overwhelms macro, and when the DXY moves on a euro-specific event (such as a European Central Bank decision) that has little to do with US liquidity. Your log will show you how often each happened.
Financial disclaimer: This article is for educational purposes only and is not financial, investment, or trading advice. Trading involves substantial risk of loss. Example figures are illustrative.