
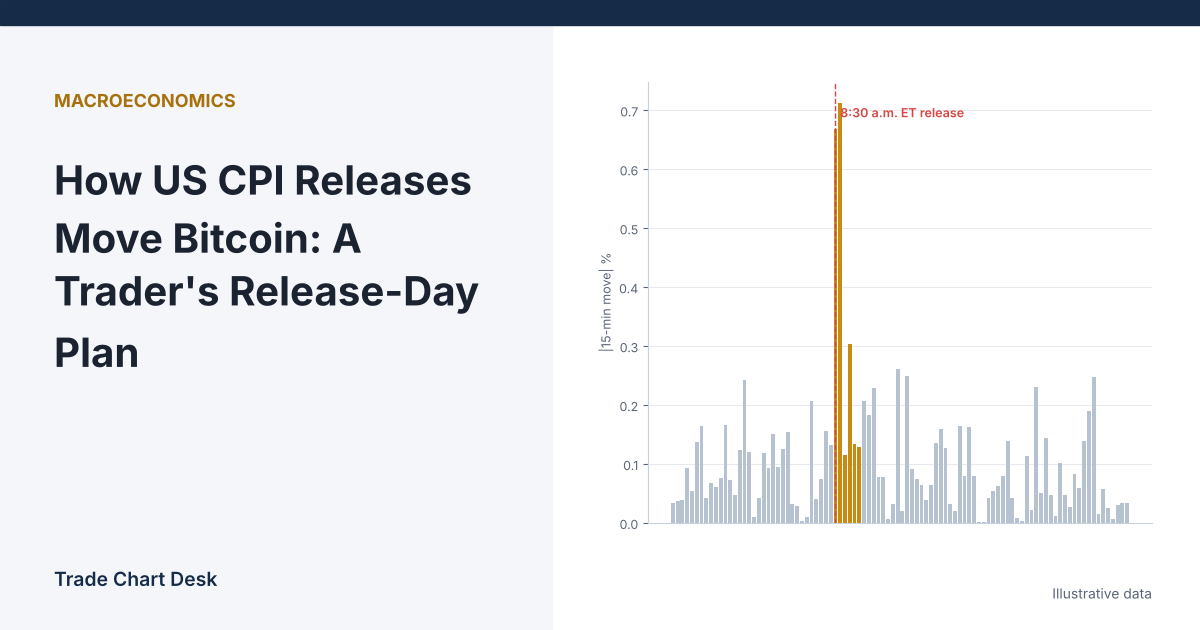
At 8:30 a.m. Eastern Time on CPI day, bitcoin can cover a normal hour’s range in a few seconds. Then it often reverses, or keeps going, or does both before the US stock market opens at 9:30. If you have a position open into that minute, the question is not “will CPI be good or bad for bitcoin?” Nobody can answer that reliably. The useful questions are: how big a move should I be ready for, what number actually surprised the market, and how do I size or step aside so that one data release does not decide my month?
This guide works through those questions with numbers, then shows how to build your own record of CPI reactions so you stop relying on memory.
The schedule is public, so the risk is too
The Consumer Price Index is published by the US Bureau of Labor Statistics (BLS), usually in the second week of the month, at 8:30 a.m. ET. The BLS posts the full calendar in advance on its CPI release schedule. For the rest of 2026 the remaining dates are:
- Tuesday, November 10, 2026: October 2026 data
- Thursday, December 10, 2026: November 2026 data
Dates do move. The release for October 2025 data was canceled, and the January 2026 release was pushed from February 11 to February 13. Check the BLS page in the week before, not a calendar you saved months ago.
Two structural details matter for crypto traders. First, bitcoin trades around the clock, so the reaction happens while US stock markets are still closed and liquidity on crypto venues can be thinner than during the main session. Second, CME Group’s bitcoin futures and options moved to 24/7 trading on May 29, 2026, according to CME’s launch announcement, so regulated futures are now also open at 8:30 a.m. on every release day.
Which number the market is actually reading
A CPI release contains dozens of figures. Four get most of the attention:
| Figure | What it covers | Why traders watch it |
|---|---|---|
| Headline CPI, month over month (seasonally adjusted) | All items, including food and energy | The first number on most news feeds |
| Headline CPI, 12-month change (not seasonally adjusted) | All items, past year | Used in headlines like “inflation at X%” |
| Core CPI, month over month | All items less food and energy | Often treated as the cleaner read on underlying inflation |
| Core CPI, 12-month change | Same, past year | Trend context for rate expectations |
Headline and core can tell different stories. In the September 2026 report (released October 14), the BLS reported headline CPI up 0.6% for the month and 3.7% over the year, while core was up 0.3% and 2.6%. Gasoline accounted for a large part of the headline increase. A trader reacting only to “0.6%” would have been reading a different story from one watching core. The BLS CPI home page publishes both, along with the detailed tables.
Surprise, not level, is what moves price
Markets price in a forecast before the release. What moves price at 8:30 is the gap between the actual figure and that forecast (the “consensus,” the median of economists’ estimates shown on most economic calendars). An illustrative scoring sheet:
| Figure | Consensus | Actual | Surprise |
|---|---|---|---|
| Headline MoM | 0.3% | 0.3% | 0.0 pp |
| Core MoM | 0.3% | 0.4% | +0.1 pp (hotter) |
| Core YoY | 3.0% | 3.1% | +0.1 pp (hotter) |
Illustrative figures only. In this example the headline matched expectations but core came in hotter. CPI is published to one decimal place, so a 0.1 percentage point miss is the smallest possible surprise, and it can still be the difference between “inline” and “hot” in the first minute.
Why would a hotter number matter for bitcoin at all? The usual channel is interest rate expectations: hotter inflation can push expected Federal Reserve rate paths higher, which tends to tighten financial conditions for risk assets. Our article on how interest rates affect bitcoin and crypto markets covers that link. It is a tendency, not a rule. Positioning going into the release often matters as much as the data itself.
Sizing for the move you should expect
You cannot know the direction, but you can estimate the size of a normal move and plan around a larger one. One method uses implied volatility (the market’s priced-in expectation of future volatility, published for bitcoin options by venues such as Deribit and by CME).
Annualized volatility scales down to a shorter period by the square root of time. Because bitcoin trades every day, use 365 days (or 8,760 hours) per year.
Worked example (illustrative numbers): bitcoin at $80,000, 30-day implied volatility at 50% annualized.
- One-day, one-standard-deviation move: 50% ÷ √365 ≈ 2.62%, or about $2,094
- One-hour, one-standard-deviation move: 50% ÷ √8,760 ≈ 0.53%, or about $427
These are averages across all hours. The 8:30 hour on CPI day is not an average hour, so treat the one-hour figure as a floor, not an estimate. Now apply it:
- You hold a long with a stop $400 below the current price. That stop is smaller than one ordinary hour’s move. On CPI day it is very likely to be tested by noise alone.
- If you widen the stop to, say, $1,200 (roughly 2.8 times the normal hourly move), keep dollar risk constant by cutting size. With a $10,000 account risking 1% ($100), size falls from $100 ÷ $400 = 0.25 BTC to $100 ÷ $1,200 ≈ 0.083 BTC.
- If the reduced size feels too small to bother with, that is the honest answer: the trade may not be worth holding through the release.
The arithmetic is the same as in our position sizing guide. The only CPI-specific part is choosing a stop distance based on the volatility you expect at 8:30, not the volatility you saw yesterday.
A release-day plan in five decisions
- Before the day: confirm the release date on the BLS schedule and write down the consensus for headline and core, MoM and YoY.
- By 8:15 a.m. ET: decide one of three states for each open position: flat, reduced to a size that survives a wide stop, or unchanged with a written reason.
- At 8:30: do not trade the first print from a news headline. Find the core MoM surprise in pp. If it is 0.0, a large move is more likely to be driven by positioning than by the data.
- 8:30 to 9:30: if you trade a reaction, wait for a defined condition (for example, a 15-minute candle closing beyond the pre-release range) and place the stop beyond the release spike, not inside it.
- After 9:30: the stock market open is a second liquidity event. Some CPI moves extend or reverse here. Decide in advance whether your plan covers it.
How CPI trades go wrong
- Tight stops that fill badly. A stop-market order triggered during a spike can fill well past the trigger. Our piece on stop-loss hunting explains why release-day stop-outs feel targeted even when they are mechanical.
- Reading the wrong number. Headline hot and core cool (or the reverse) can produce an initial move that reverses within minutes once traders read the full release.
- The first-minute trap. The first move is often not the move. Spread widening and thin books exaggerate the first seconds on some exchanges.
- Assuming the relationship is fixed. In some periods crypto reacts strongly to inflation data; in others, ETF flows, regulation or crypto-specific news dominate and CPI barely registers.
- Leverage into the release. A liquidation price inside the expected 8:30 range is a decision to let the data close your position.
Build your own CPI reaction log
Instead of trusting anyone’s claim about how bitcoin “usually” reacts, measure it. For each past release date on the BLS schedule, record in a spreadsheet:
- Consensus and actual for headline and core (MoM and YoY), and the core MoM surprise in pp
- BTC price at 8:25, 8:35, 9:30 and 12:00 ET, taken from 1-minute candles on the exchange you actually trade
- The high-low range from 8:30 to 9:30, and the same hour’s range on the previous five non-CPI weekdays
Divide the CPI-hour range by the average non-CPI range. After a year of releases, you have your own multiplier for how much larger the release hour tends to be, measured on your venue. Then check whether larger surprises lined up with larger ranges, and how often the 8:35 direction held until noon. Record your own trades in the same sheet. Our trading journal guide shows a layout that works for this.
A dozen releases a year is a small sample. Treat the results as a description of what happened, not a probability you can rely on.
Financial disclaimer: This article is for educational purposes only and is not financial, investment, or trading advice. Trading involves substantial risk of loss. Example figures are illustrative.
1 thought on “How US CPI Releases Move Bitcoin: A Trader’s Release-Day Plan”