
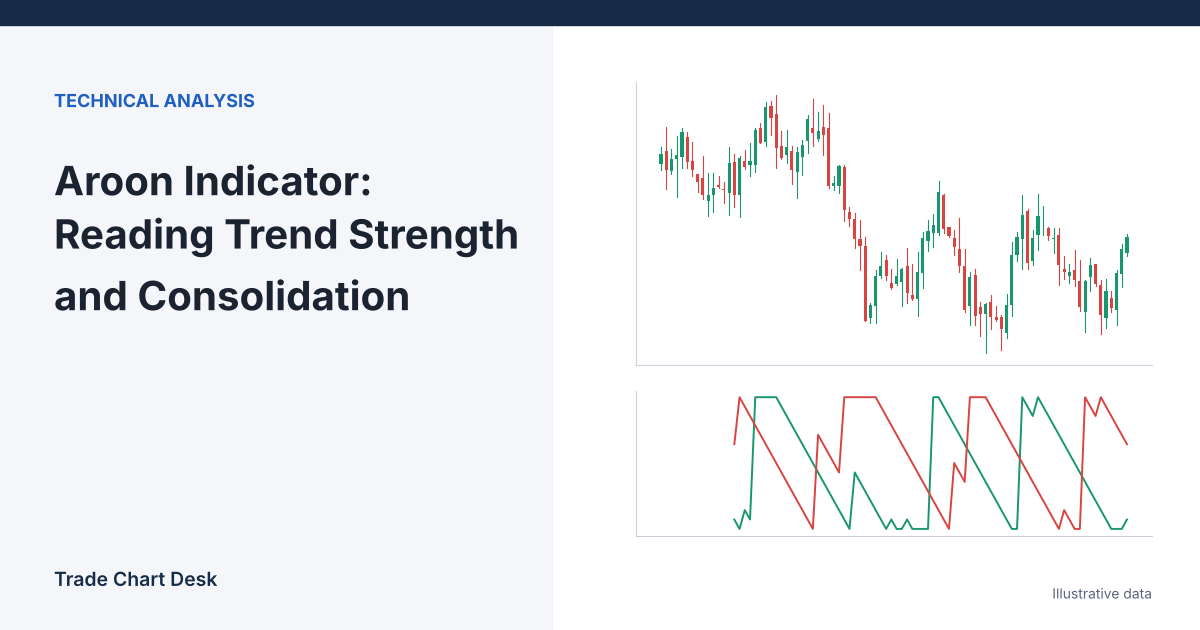
Most trend indicators measure distance: how far price is from an average, how big the recent moves were. Aroon measures time. Its only question is how many bars ago did the highest high and the lowest low of the lookback window happen? If new highs keep arriving, the trend is fresh. If the last high is getting old, the trend is aging, whatever price is doing in between.
Thinking of Aroon as a clock rather than a gauge makes its readings predictable, and once you can predict them you stop being surprised by them. This guide shows the clock ticking in a worked example, then turns it into a consolidation check you can apply bar by bar.
The formula, and why the lines move in steps
Aroon was developed by Tushar Chande in 1995; the name comes from the Sanskrit for “dawn’s early light.” TradingView’s Aroon help page gives the calculation for a 14-period setting:
- Aroon Up = ((14 − bars since the 14-period high) / 14) × 100
- Aroon Down = ((14 − bars since the 14-period low) / 14) × 100
TradingView’s built-in Aroon loads with a length of 14. Many other sources and platforms use 25, so check which one you are looking at before comparing readings.
Because “bars since” is a whole number, each line can only take 15 values at length 14: 100, 92.9, 85.7 and so on down to 0, in steps of 100 / 14 ≈ 7.14. A line at 100 means the extreme happened on the current bar. Every bar without a new extreme subtracts 7.14. After 14 bars without a new high, Aroon Up reaches 0.
That gives you a quick translation table for length 14:
| Bars since the extreme | 0 | 3 | 7 | 11 | 14 |
|---|---|---|---|---|---|
| Aroon value | 100 | 78.6 | 50.0 | 21.4 | 0 |
At length 25, each step is 4, and 50 means the extreme was 12.5 bars ago. The same thresholds mean different amounts of time at different lengths.
The Aroon Oscillator is simply Aroon Up minus Aroon Down, ranging from −100 to +100, as described on TradingView’s Aroon Oscillator page.
A worked example: the trend stops, the clock keeps running
Illustrative daily bars for a coin that rallied steadily, printed its highest high of 115 on bar 14, and then went sideways between roughly 109.5 and 114.8. Length is 14.
| Bar | High | Low | Bars since high | Bars since low | Aroon Up | Aroon Down | Oscillator |
|---|---|---|---|---|---|---|---|
| 14 | 115.0 | 112.0 | 0 | 14 | 100.0 | 0.0 | +100.0 |
| 16 | 113.0 | 110.0 | 2 | 13 | 85.7 | 7.1 | +78.6 |
| 18 | 112.0 | 109.5 | 4 | 14 | 71.4 | 0.0 | +71.4 |
| 21 | 112.5 | 109.8 | 7 | 14 | 50.0 | 0.0 | +50.0 |
| 24 | 113.2 | 110.4 | 10 | 14 | 28.6 | 0.0 | +28.6 |
| 26 | 114.2 | 111.2 | 12 | 14 | 14.3 | 0.0 | +14.3 |
| 27 | 113.6 | 110.8 | 13 | 9 | 7.1 | 35.7 | −28.6 |
| 28 | 115.3 | 112.4 | 0 | 10 | 100.0 | 28.6 | +71.4 |
Three things are worth noticing.
Aroon Up fell steadily even though price did not fall. From bar 14 to bar 26, price moved sideways, yet Aroon Up lost 7.14 every bar. That is the clock at work: no new high, so the reading ages.
Aroon Down stayed near zero for most of the range. During the rally, the lowest low in the window was always the oldest bar, so “bars since low” sat at 13 or 14. The window kept sliding forward and dropping the oldest bar, which kept that number near the maximum. Aroon Down only woke up at bar 27, when the old rally lows had rolled out of the window and a low inside the range became the window’s extreme. So “both lines below 50” was technically true from bar 22, eight bars after the high, but only because Aroon Up had aged past the halfway mark while Aroon Down was still pinned near zero by the old rally lows. That is a stalled uptrend, not the two lines drifting down together that TradingView describes as the stronger consolidation signal.
The oscillator crossed below zero for one bar, then snapped to +71.4. Bar 28 broke above 115, Aroon Up jumped from 7.1 to 100 in one step. Aroon lines do not glide; they reset instantly when a new extreme prints. A one-bar crossover in a range is not a trend change.
Reading the two lines together
| Pattern | What the clock says | How to treat it |
|---|---|---|
| Up near 100, Down below 30 | Recent new highs, no recent new lows | Uptrend is fresh. TradingView describes Up above 50 and near 100 with Down below 50 as a strengthening uptrend. |
| Up falling in steps, Down still near 0 | The trend has stopped making highs, but the window still contains the old lows | Early stall. Price may be ranging or pulling back. Aroon Down cannot react yet. |
| Both below 50 | Neither extreme is recent | TradingView treats this as consolidation, stronger when both fall in parallel |
| Lines cross | The more recent extreme has switched sides | One step in TradingView’s three-step trend-formation sequence (cross, lines move apart, one reaches 100), not a signal on its own |
| One line hits 100 | A new extreme on this bar | Confirms the cross if it arrives after one |
A consolidation check you can apply
Aroon is most useful as a filter: it tells you whether a trend-following setup is likely to have a trend to follow. Here is one way to make that concrete. The numbers are starting points to test, not recommendations.
- Trend present: one line is at 71.4 or higher (extreme within the last 4 bars at length 14) and the other is at 28.6 or lower (extreme at least 10 bars old).
- Consolidating: both lines at 50 or lower for at least 3 consecutive bars. In the example this first holds at bar 23.
- Undecided: anything else. This includes bars 19 to 22 in the example, where Aroon Up is falling through the middle but the trend has not clearly ended.
A trend-following trader might only take breakout or crossover entries in state 1 and stand aside in state 2. A range trader might do the opposite. Note that in the example the range began right after bar 14, but the check only flagged it at bar 23. Also record which line is near zero: “both below 50” with one line pinned at 0 is an aging trend, while both lines in the 15 to 45 area means extremes on both sides are old, which is a more genuine range.
When state 2 ends with one line jumping to 100, that is the moment breakout traders watch. Combine it with a price-based test, such as those in our breakout and retest guide, because Aroon will register a one-tick poke above the range as a new high just as readily as a real breakout.
Where Aroon gets it wrong
- It ignores magnitude. A new high by a single tick scores exactly the same 100 as a new high by 10%. Aroon cannot tell a grinding drift from a strong trend if both keep printing new extremes.
- Wicks reset it. Aroon uses highs and lows, so a brief liquidation wick creating a new low sets Aroon Down to 100. In crypto, where wicks are common, check the bar that caused the reset.
- The window edge. As the example showed, Aroon values change when old bars roll out of the window, even when nothing new happens in price. A sudden drop in one line can be the anniversary of an old extreme, not new information.
- Lookback mismatch. Aroon at 14 on daily bars sees two weeks. A trend on the weekly chart may look like repeated consolidation on a 14-day Aroon. Match the length to the timeframe of the trend you are trying to trade.
- Implementation detail. Platforms can differ in whether the window includes the current bar plus 14 previous bars or 14 bars in total, and in how they break ties when two bars share the same high. Values can differ by one step across platforms.
Aroon alongside other trend tools
Aroon’s time-based view complements price-based tools. A Donchian channel uses the same highest-high and lowest-low window, but plots the price levels rather than how long ago they formed, so a Donchian breakout and Aroon Up hitting 100 are the same event seen two ways. Momentum oscillators like TRIX measure how fast a smoothed price is moving, which Aroon ignores. Using Aroon to classify the regime and a separate tool to time entries keeps each indicator doing the one job it does well. The market structure guide covers the manual version of the same idea: are new highs and lows still being made?
Verify it on your chart
- Add Aroon at length 14 and set the Donchian channel to the same length. Every time Aroon Up hits 100, the upper Donchian band should have just moved up. If not, check whether the two use the same window definition.
- Pick a recent range on your chart. Count bars from the last new high to the first bar where both Aroon lines are below 50. Write that number down; it is your real-world lag for spotting consolidation at this length.
- Repeat on three more ranges and at length 25. Log the results in your trading journal, and choose the length based on the lag you can accept.
Financial disclaimer: This article is for educational purposes only and is not financial, investment, or trading advice. Trading involves substantial risk of loss. Example figures are illustrative.