
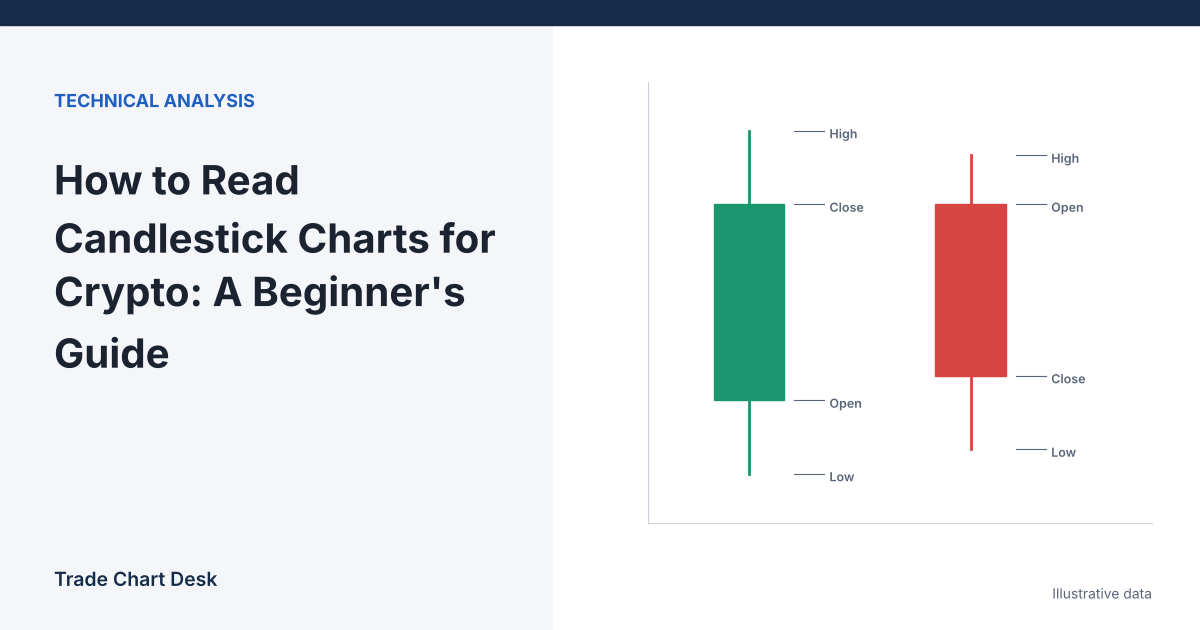
You open a Bitcoin chart for the first time and see rows of red and green boxes with thin lines poking out of them. Each one is a candle, and each candle answers four questions about a slice of time: where did price start, how high did it go, how low did it go, and where did it finish? Once you can read those four numbers off a single candle, everything else on a price chart (patterns, support and resistance, indicators) is built from the same information. This guide walks through one candle in detail, then covers the two things that make crypto candles different from stock charts: there is no closing bell, and gaps are rare.
One candle, taken apart
Take a 1-hour BTC/USDT candle with these illustrative values:
| Field | Value | Meaning |
|---|---|---|
| Open | $60,250 | Price of the first trade in the hour |
| High | $60,480 | Highest trade in the hour |
| Low | $60,120 | Lowest trade in the hour |
| Close | $60,410 | Price of the last trade in the hour |
Because the close ($60,410) is above the open ($60,250), most charts draw this candle green (some use hollow or white). If the close were below the open, it would be red (or filled/black). The color tells you only one thing: whether price finished the period higher or lower than it started. It says nothing about whether the move was large or small.
Now break it into parts:
- Body = |close − open| = $60,410 − $60,250 = $160. The thick part of the candle, between open and close.
- Upper wick (also called upper shadow) = high − the higher of open and close = $60,480 − $60,410 = $70.
- Lower wick = the lower of open and close − low = $60,250 − $60,120 = $130.
- Range = high − low = $60,480 − $60,120 = $360. Check: 160 + 70 + 130 = 360.
- Body as a share of range = 160 ÷ 360 ≈ 44%.
Read in words: during this hour, sellers pushed price $130 below the open at some point, buyers then lifted it to $70 above where it finally closed, and the hour ended $160 higher than it began. The lower wick is about twice the upper wick, so the deeper excursion was to the downside and it was rejected. That is a description, not a forecast. A single candle tells you what happened in one hour, not what happens in the next one.
Why the body-to-range ratio is useful
Two green candles can both rise $160 and still look completely different. One with a $170 range (body about 94% of range) means price moved almost straight from open to close. One with a $900 range (body about 18%) means a wild hour that went nearly nowhere. Many named patterns are statements about this ratio: a doji has a tiny body relative to its range, a hammer a long lower wick. Learning to estimate body, wicks and range by eye comes before pattern names.
Where does a crypto candle “open”?
Stock candles have natural boundaries: the market opens at 9:30 a.m. and closes at 4:00 p.m. New York time, so a daily candle is the trading day. Crypto trades all day, every day, so a daily candle’s open is simply wherever someone decided the day starts.
- Most crypto exchanges and charting sites build daily candles from 00:00 to 23:59:59 UTC. TradingView’s charting library documentation specifies that a daily bar’s timestamp represents the start of the trading day at 00:00 UTC.
- For a trader in New York, 00:00 UTC is 8:00 p.m. the previous evening during daylight saving time and 7:00 p.m. in winter. So the “Tuesday” daily candle actually starts Monday evening local time.
- Some platforms let you change this. Binance’s spot API documentation, for example, has a
timeZoneparameter for kline (candle) data that defaults to UTC and, when set, interprets the intervals in a different time zone.
Why this matters: the same 24 hours of trading can produce different daily candles depending on where the day boundary is drawn. Suppose BTC drifts down from $61,000 to $59,500 between 18:00 and 00:00 UTC, then climbs to $61,800 by the next evening. A UTC daily candle opens near $59,500 and closes near $61,800, a large green candle. A daily candle cut at a different hour might start near $61,000 and show a much smaller body, or even a different shape. A “bullish engulfing” or “hammer” on the daily chart may exist on one boundary and not the other.
Two practical rules follow:
- Know your chart’s day boundary. Changing the time zone display in your chart settings usually changes the time labels on the axis. Whether it also changes how daily candles are built depends on the platform, so check by comparing a daily candle’s open with the hourly candle at your expected boundary.
- Stay consistent. If you study patterns on UTC candles, test and trade them on UTC candles. Mixing boundaries is one of the quiet ways beginner journals become meaningless.
Intraday candles (1-hour, 4-hour) have the same issue on a smaller scale. 4-hour candles on most crypto charts start at 00:00, 04:00, 08:00 UTC and so on.
Gaps: rare in crypto, common in textbooks
On a stock chart, a gap appears when today’s open is away from yesterday’s close because news arrived overnight. In a market that never closes, the next candle opens one trade after the previous candle closed, so on liquid spot pairs the open is usually equal to, or within a few dollars of, the prior close.
This has a direct effect on how you read patterns. Many classic candlestick definitions were written for stocks and require gaps. The textbook bullish engulfing, for example, asks for the second candle to open below the first candle’s close. On BTC/USDT the second candle typically opens at the first candle’s close, so the strict rule is rarely met and traders use a body-only version. Our bullish engulfing guide covers how to handle that.
Where you will still see gaps on crypto charts:
- Futures continuous charts, where one contract is stitched to the next at expiry. See our article on CME futures gaps.
- Exchange outages or maintenance, where no trades print for a while.
- Thinly traded pairs, where minutes can pass between trades on low timeframes.
The candle is not finished until it closes
The rightmost candle on your chart is live. Its high, low and close change with every trade until the period ends. A beautiful long lower wick at 14:40 can become a plain red candle by 15:00. If you act on a pattern before the candle closes, you are acting on a pattern that may not exist. The simple habit: decide on the closed candle, and if you trade intraday, note the time remaining in the current candle before you look at its shape.
Reading several candles together
Single candles matter less than sequences and location. Three questions do most of the work:
- Are highs and lows rising, falling or overlapping? This is market structure, covered in our guide to higher highs, lower lows, BOS and CHoCH.
- Are bodies getting bigger or smaller? Shrinking bodies in a rally can mean the move is losing push. Expanding bodies mean the opposite.
- Where is this happening? A long lower wick in the middle of nowhere is noise. The same wick at a well-tested support zone is worth a closer look.
Multi-candle patterns are built from these ideas. Flags, for example, are a strong burst of large candles followed by a stretch of small overlapping ones (see bear flag vs bull flag), and a head and shoulders is a sequence of three swing highs (see how to calculate the head and shoulders target).
Common beginner misreadings
- “Green means buyers won.” A green candle can close lower than the previous candle’s close if it opened lower. Compare closes across candles, not just colors.
- “A long wick means a reversal.” Wicks show rejection inside one period. Whether that matters depends on location and what comes next.
- Comparing candles from different exchanges. Highs and lows differ between venues, especially during spikes. A wick that hit your stop on one exchange may not exist on another.
- Starting on 1-minute charts. Learn on 4-hour and daily candles, where each candle represents more trading.
Practice exercise
- Open a BTC/USDT daily chart and set the time zone to UTC.
- Hover over ten consecutive closed candles and write down open, high, low and close for each (most platforms show these in the top-left of the chart).
- For each candle, calculate body, upper wick, lower wick, range and body-to-range ratio, as in the example above.
- Describe each candle in one sentence without using a pattern name (“opened at X, sold off to Y, recovered to close Z”).
- Switch to the 4-hour chart and check one day: the first 4-hour candle’s open should equal the daily open, the last one’s close should equal the daily close, and the highest high and lowest low of the six should match the daily high and low. If they do not, your day boundary is different from what you assumed.
If you want to keep improving, log what you notice in a trading journal so you can check later which observations actually helped.
Financial disclaimer: This article is for educational purposes only and is not financial, investment, or trading advice. Trading involves substantial risk of loss. Example figures are illustrative.
1 thought on “How to Read Candlestick Charts for Crypto: A Beginner’s Guide”