
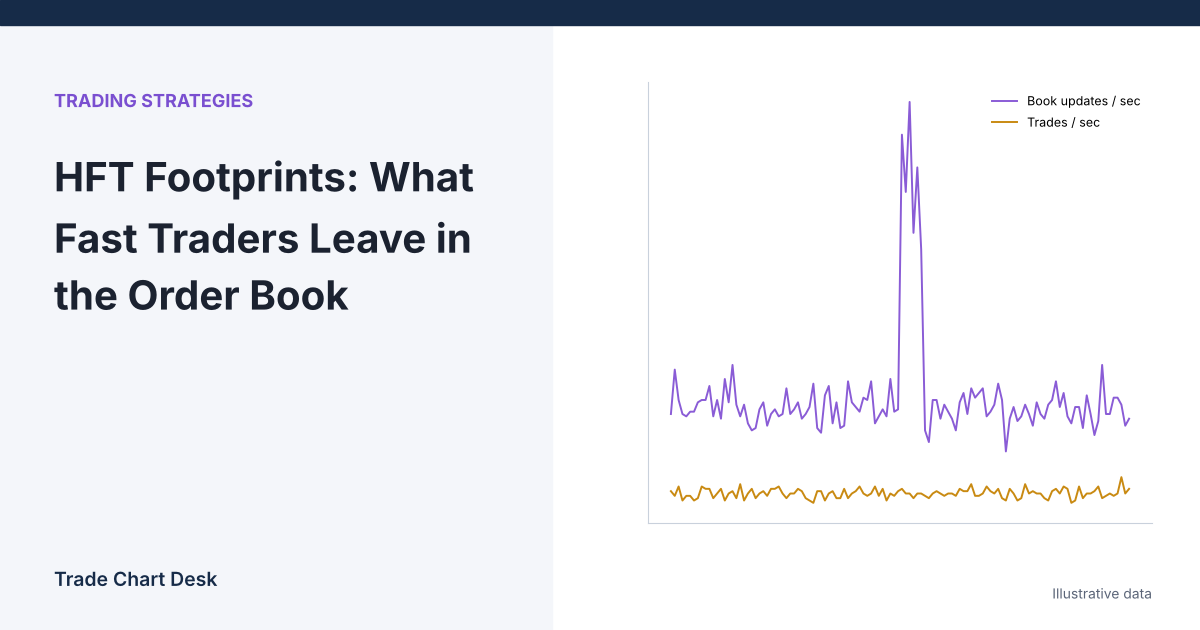
Watch a BTC order book for one minute and you will see thousands of changes and only a few dozen trades. Quotes flicker at the best bid and ask, size appears and vanishes several levels deep, and a burst of tiny fills hits in the same millisecond. Most of that activity comes from automated market makers and other high-frequency participants. A chart trader cannot see who they are, but can learn to recognize what their activity looks like in public data, and, just as important, what that data cannot tell you.
What “HFT” actually means
There is no single legal definition. The US SEC staff’s literature review on high-frequency trading lists five characteristics drawn from its 2010 concept release, noting that a firm need not have all of them:
- very high-speed, sophisticated programs for generating, routing and executing orders;
- co-location and direct data feeds to cut delays;
- very short time frames for opening and closing positions;
- many orders that are cancelled shortly after submission;
- ending the day close to flat.
That review was about US equities, but the same behaviors show up on crypto exchanges, which run continuous order books and offer fast API connections. In crypto, much of this activity is market making: quoting both sides of the book and earning the spread (and sometimes exchange maker rebates) while trying to keep inventory small.
The footprints you can actually see
1. Many book updates per trade
Because market makers re-price quotes every time the market moves, book updates vastly outnumber trades. You can measure this yourself with an order-to-trade style count.
Worked example (illustrative): in one minute you log 1,240 changes to the top five levels of the book and 37 aggregated trades. That is 1,240 ÷ 37 ≈ 33.5 book updates per trade. The absolute number depends on your feed: a stream that pushes snapshots every 1,000 ms will show far fewer changes than one at 100 ms. Binance’s spot depth streams, for example, offer both speeds, while its best-bid/ask ticker stream pushes every change in real time. So compare the ratio against itself over time on the same feed, not against someone else’s screenshot.
What a rising ratio usually means: quotes are being revised faster than anything trades, typical of a market where makers are nervous about being picked off. What it does not mean: that someone is “faking” the book.
2. Depth that vanishes before events
Market makers carry inventory risk. When a big move becomes more likely (a scheduled CPI release, a sharp move on another venue), they widen quotes or pull them.
Worked example (illustrative): five minutes before a scheduled US data release, the book holds 42 BTC of bids and asks within 10 basis points (0.10%) of the mid. Thirty seconds before the release it holds 9 BTC. Depth in that band fell 1 − 9 ÷ 42 ≈ 79%. Nobody had to sell for that to happen; liquidity providers simply stepped back. Any market order that hits the book now moves price much further than it would have five minutes earlier. Our guide to CPI and Bitcoin volatility covers the event side.
3. The spread and slippage you pay
The cleanest way to see market makers is through what it costs you to cross their quotes. Take this illustrative ask side (mid-price $59,995):
| Ask price | Size (BTC) | Filled for a 5 BTC market buy |
|---|---|---|
| 60,000 | 0.9 | 0.9 |
| 60,010 | 1.1 | 1.1 |
| 60,020 | 0.7 | 0.7 |
| 60,030 | 2.4 | 2.3 |
Average fill: (0.9×60,000 + 1.1×60,010 + 0.7×60,020 + 2.3×60,030) ÷ 5 = $60,018.80. That is $23.80 above mid, about 4 basis points, before fees. If the depth thins as in footprint 2, the same order walks further. This is the practical meaning of “liquidity”: how much a given size moves the price.
4. Bursts of small, same-time trades
On many exchanges, one large market order that sweeps several resting orders is reported as several fills with the same timestamp. Binance’s aggregated-trade stream groups fills from a single taker order together. Clusters of tiny trades at different times, by contrast, often come from algorithms slicing a bigger order into pieces. Both are visible on the tape; neither tells you whether the trader is a fund, a market maker hedging, or one person with a bot.
5. Quotes that follow other venues
Prices across major exchanges move almost together because arbitrage algorithms buy on one venue and sell on another within milliseconds. If you put the same pair from two exchanges on a 1-second chart, you will see one lead and the other snap to it. That is the footprint of cross-venue arbitrage, and it is why one exchange’s book is never the whole picture.
What retail data cannot tell you
| Question | Can public data answer it? | Why not |
|---|---|---|
| Who placed this order? | No | Public feeds are anonymous. Exchanges see account IDs; you do not. |
| Was that cancelled order a spoof? | No | Spoofing requires intent to cancel before execution. Legitimate makers cancel constantly when price moves. |
| Is the market maker long or short? | No | Inventory and hedges on other venues or in options are invisible. |
| Will this displayed size still be there? | Only after the fact | Orders can be pulled faster than your feed updates. |
| Is there hidden size at this level? | Partly | You can infer refilling when more trades at a level than was displayed. You cannot see it in advance. |
| Are “they” hunting my stop? | Not from charts | Stops cluster at obvious levels and get swept by ordinary flow too. See our stop-loss hunting explainer. |
Speed also matters. A professional connected close to the exchange matching engine reacts in microseconds to milliseconds. A retail browser feed batched at 100 ms is, from their point of view, describing the past. Any edge that depends on reacting to a book change faster than they do is not available to you.
Mistakes traders make with this data
- Calling every vanishing wall manipulation. The more likely explanation is a market maker repricing. Treat it as a liquidity change, not a conspiracy.
- Treating a heatmap of resting orders as support. A bright band of bids is a statement of current willingness, withdrawable at any moment.
- Ignoring costs. Strategies that look good on tick data often disappear once you add the spread, slippage and taker fees you would actually pay.
- Using one exchange as the market. For major coins, price discovery is spread across venues and derivatives.
How to use it anyway
The useful retail takeaway is about execution, not prediction:
- Measure your own costs. For your next 20 market orders, record the mid-price at the moment you clicked and your average fill. The difference in basis points is your real cost of immediacy. Log it in your trading journal.
- Check depth before size. Before a larger order, add up the asks or bids within 0.1% of mid. If your order is a large fraction of it, split it or use limit orders.
- Avoid scheduled thin windows. Compare depth five minutes before and thirty seconds before a scheduled event for a few weeks. If it consistently collapses, do not place market orders in that window.
- Read imbalance carefully. If you want to turn book data into a number, our order book imbalance guide shows how to compute it and how to filter orders that never trade.
Financial disclaimer: This article is for educational purposes only and is not financial, investment, or trading advice. Trading involves substantial risk of loss. Example figures are illustrative.
1 thought on “HFT Footprints: What Fast Traders Leave in the Order Book”