Bollinger Band Squeeze Tutorial: BandWidth, Breaks, Head Fakes
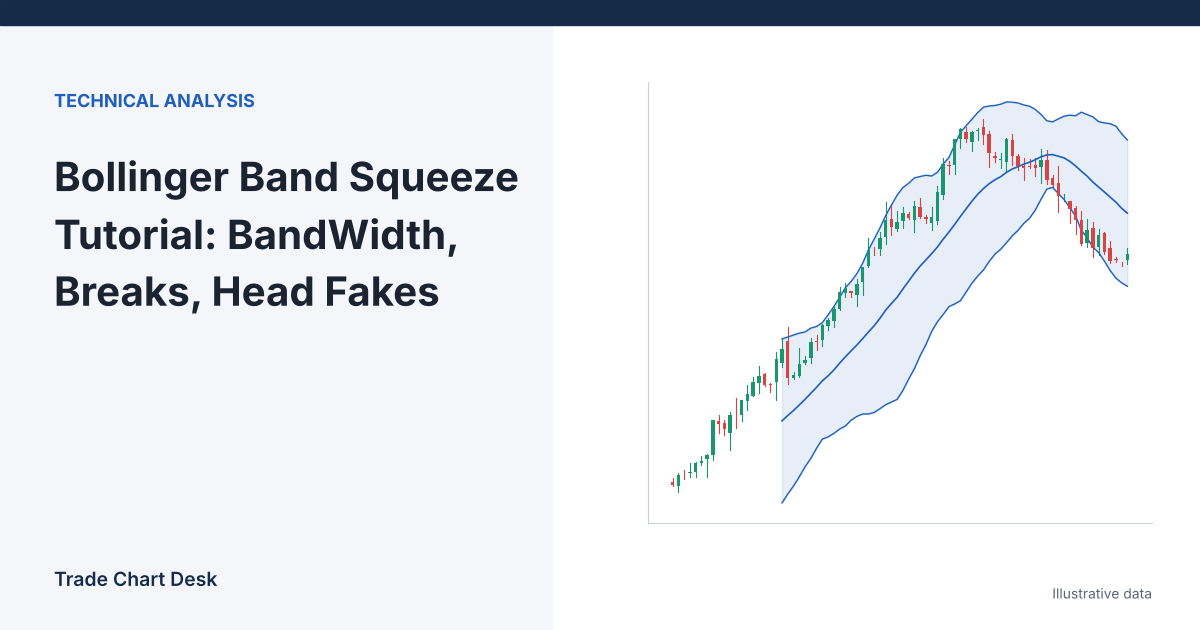
Illustrative chart for the article "Bollinger Band Squeeze Tutorial: BandWidth, Breaks, Head Fakes"

Most squeeze tutorials say “when the bands get narrow, a big move is coming.” That sentence hides two problems. First, “narrow” means nothing until you put a number on it. Second, a squeeze tells you volatility is low, not which way price will leave. This tutorial fixes both: you will calculate the bands and BandWidth … Read more
Crypto Liquidation Heatmaps: What They Estimate and How to Read Them

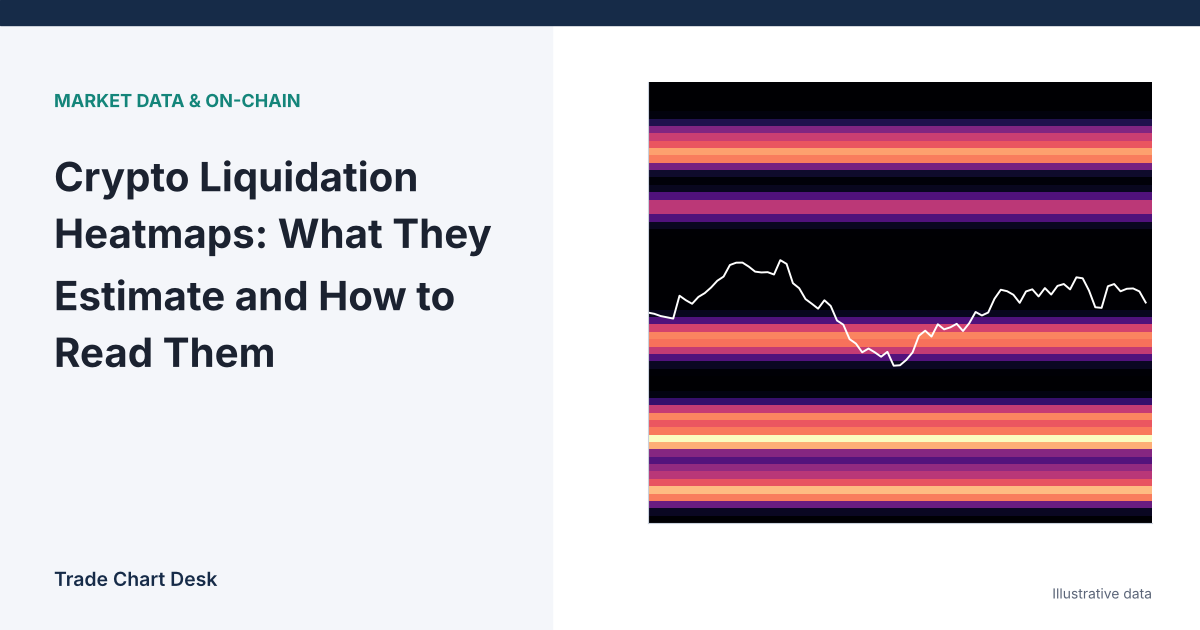
Illustrative chart for the article "Crypto Liquidation Heatmaps: What They Estimate and How to Read Them"

The most common misreading of a liquidation heatmap is treating the bright yellow band as a wall of real orders sitting at that price. It is not. No exchange publishes the liquidation prices of other traders’ positions. Every heatmap you see on a data site is a model’s guess, built from public data plus assumptions … Read more