
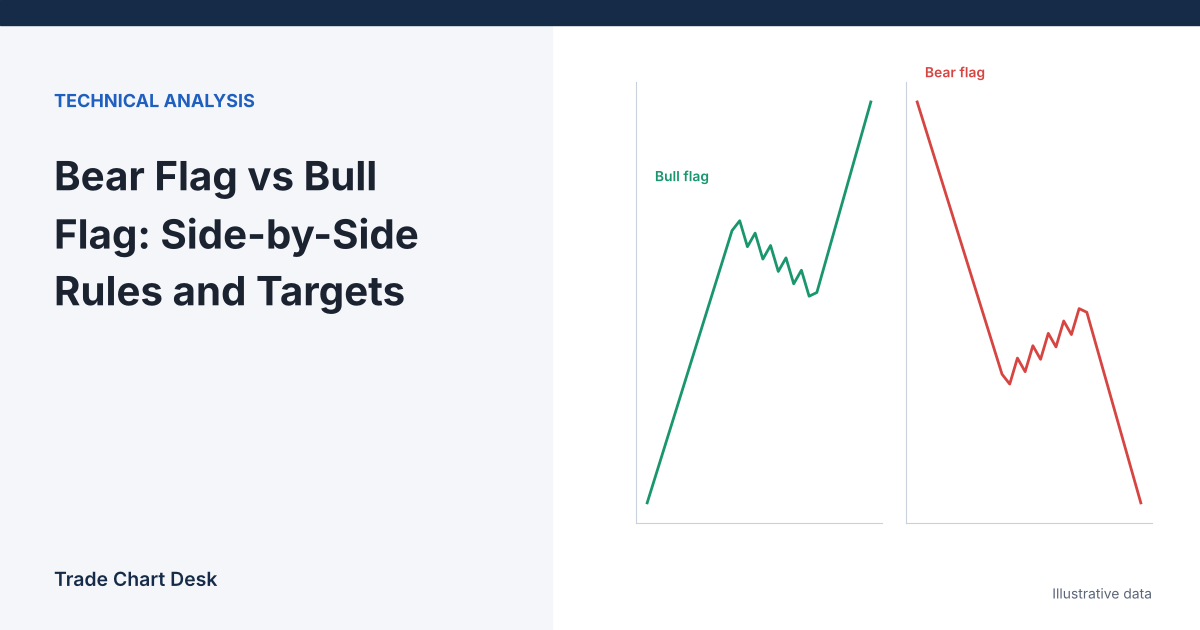
A bull flag and a bear flag are the same pattern pointed in opposite directions: a sharp move (the pole), a short pause that drifts against that move (the flag), then a break in the original direction. Because they are mirror images, the most useful way to learn them is side by side. The differences that matter in practice are not in the shape. They are in where each one tends to appear, how you measure it, and how it fails. This article uses one comparison table as its spine and then works through a measured-move calculation for each.
Flags are read from candle sizes and overlaps, so if you are still learning to read bodies and wicks, start with how to read candlestick charts for crypto.
The comparison
| Bull flag | Bear flag | |
|---|---|---|
| Pole | Fast rise made of several large green candles | Fast drop made of several large red candles |
| Flag | Small, tight channel drifting sideways or down | Small, tight channel drifting sideways or up |
| Breakout | Close above the flag’s upper line | Close below the flag’s lower line |
| Invalidation | Close below the flag’s low | Close above the flag’s high |
| Measured move | Pole height added upward | Pole height subtracted downward |
| Typical setting | Uptrend with higher highs and higher lows | Downtrend with lower highs and lower lows |
| Common trap | Late buyers chase the breakout candle near the top | Shorts squeezed when the flag keeps rising into a reversal |
Two definitional points apply to both. First, the pole must be a quick, near straight-line move. Bulkowski’s flag pattern guide puts it bluntly: no flagpole, no flag. Second, flags are short. On daily charts Bulkowski defines them as lasting less than three weeks; longer consolidations are better treated as rectangles or channels. On lower timeframes, scale that idea down: the flag should be brief compared with the pole, not a new range of its own.
A pennant is the same idea with converging trendlines instead of parallel ones. The measurement is the same.
Measuring a bull flag
Illustrative BTC 4-hour chart:
- Pole: from $58,000 to $64,200. Pole height = $6,200.
- Flag: drifts down in a tight channel to a low of $61,800. Upper line of the flag near the breakout: $63,400.
- Retracement of the pole = ($64,200 − $61,800) ÷ $6,200 ≈ 39%.
There are two common ways to project the pole:
| Project from | Calculation | Target |
|---|---|---|
| Flag low (Bulkowski’s method for upward breakouts) | $61,800 + $6,200 | $68,000 |
| Breakout point | $63,400 + $6,200 | $69,600 |
The flag-low method is more conservative because it starts from the bottom of the pause. The difference is the height of the flag itself, $1,600 here. If you measure in percent instead (the pole was a 10.7% rise, $6,200 ÷ $58,000), the breakout-point projection becomes $63,400 × 1.107 ≈ $70,177. Choose one method and keep it.
A simple plan. Entry on a 4-hour close above the flag at $63,500. Stop below the flag low with a buffer: $61,600. Risk per BTC: $1,900. Target: $68,000 (flag-low method). Reward: $4,500. Reward-to-risk ≈ 2.37. With $100 at risk, size = 100 ÷ 1,900 ≈ 0.053 BTC. See crypto position sizing for the formula.
Measuring a bear flag
Illustrative ETH 4-hour chart:
- Pole: from $3,100 down to $2,650. Pole height = $450.
- Flag: drifts up to a high of $2,780. Lower line of the flag near the breakdown: $2,700.
- Retracement of the pole = ($2,780 − $2,650) ÷ $450 ≈ 29%.
| Project from | Calculation | Target |
|---|---|---|
| Flag high (Bulkowski’s method for downward breakouts) | $2,780 − $450 | $2,330 |
| Breakdown point | $2,700 − $450 | $2,250 |
| Breakdown point, percent-based | $2,700 × (1 − 450 ÷ 3,100) | ≈ $2,308 |
Notice the asymmetry in the percent version. The pole was a 14.5% decline, and a 14.5% decline from a lower starting price is a smaller dollar move. On large crypto moves this difference grows, which is one reason dollar and percent targets disagree more on bear flags after big drops.
Where they differ in practice
Bull flags fail by fading
The typical bull-flag failure is a flag that keeps sagging until it retraces most of the pole, then breaks down. A common rule of thumb is to be suspicious when the flag retraces more than about half the pole; at that point the “pause” has given back too much of the move to still be a pause. In the example above, a flag low below $61,100 would retrace more than 50%.
Bear flags fail by squeezing
In crypto derivatives, a bear flag often forms while short positions build up. If the flag rises through its upper line instead, those shorts may be forced to buy back, and the move up can be fast. That is the reason a bear flag’s invalidation (a close above the flag high) needs to be defined before entry, not improvised. Funding rates and open interest can tell you how crowded the short side is; see open interest spikes for how to read that.
Setting matters more than shape
A bull flag forming under a major resistance zone, or a bear flag forming just above major support, is fighting the higher-timeframe picture. The measured target may sit beyond a level that has to break first. Check what lies between the breakout and the target before trusting the projection.
Mistakes common to both
- Calling any pause a flag. A slow grind followed by a sideways range is not a flag. Without a fast pole, the measured move has nothing to measure.
- Acting on wicks. A wick through the flag line is not a breakout. Wait for the candle close on your chosen timeframe. On 24/7 crypto, also know when that candle closes; most 4-hour candles start at 00:00, 04:00, 08:00 UTC and so on.
- Ignoring volume. Traders usually look for activity to quiet down during the flag and pick up on the breakout. On crypto, exchange volume is fragmented and sometimes unreliable; compare volume across more than one venue before reading much into it.
- Weekend and holiday flags. Crypto trades through weekends, but liquidity is often thinner. A flag that forms on Saturday may be quiet because no one is trading, not because the market is pausing.
- Mixing up flags and reversal patterns. A flag is a continuation pattern. If price breaks the other way, you are no longer dealing with a flag. Reversal structures like the head and shoulders use a different measurement; see how to calculate the head and shoulders target.
A test you can run
- Pick one pair and one timeframe. Write your rules: maximum flag length (for example, no more than half the number of candles in the pole), maximum retracement (for example, 50%), breakout on close, target method.
- Scroll back and mark every flag that met the rules at the time the breakout candle closed. Include the ones that failed.
- For each, record: pole height, retracement, target, the furthest price reached in the breakout direction before invalidation, and whether the target or the stop came first.
- Split the results by bull versus bear and by retracement depth (under 38%, 38–50%). Do not merge them; the whole point is to see whether they behave differently on your market.
Financial disclaimer: This article is for educational purposes only and is not financial, investment, or trading advice. Trading involves substantial risk of loss. Example figures are illustrative.
1 thought on “Bear Flag vs Bull Flag: Side-by-Side Rules and Targets”