
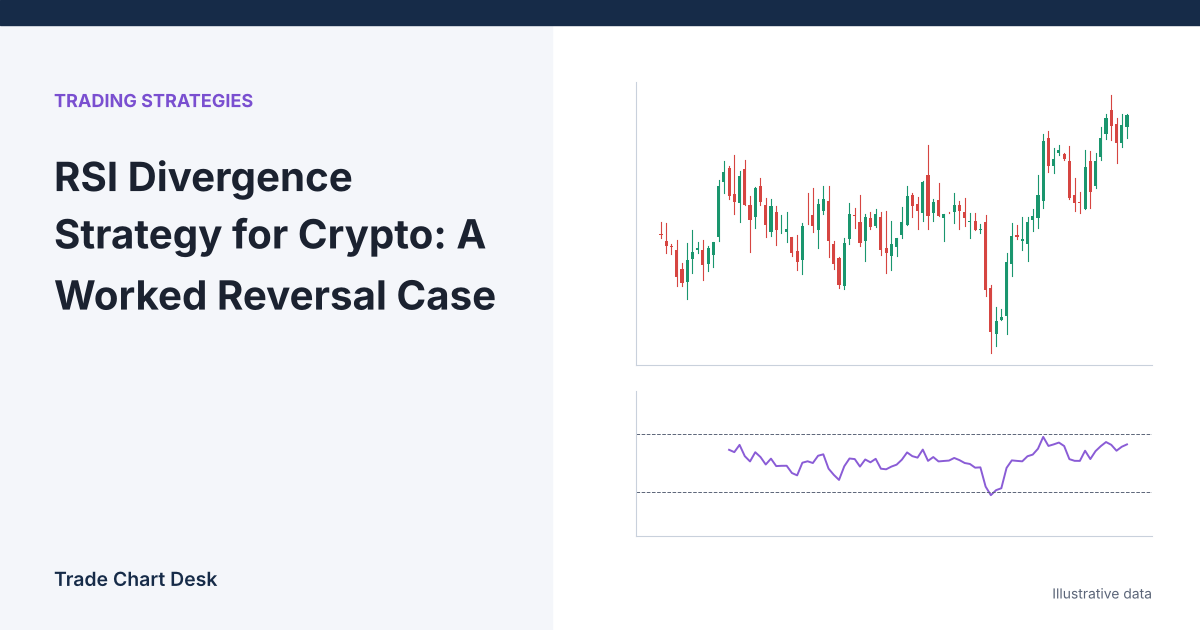
“Price made a lower low but RSI made a higher low, so the downtrend is losing steam.” That is the textbook definition of bullish RSI divergence, and it is accurate as far as it goes. What the textbook skips is why RSI behaves that way, how long a divergence can persist while price keeps falling, and what a complete, testable trade around it looks like. This article works through one illustrative case from start to finish, then changes one input at a time to show where the setup breaks.
This guide covers regular divergence, the reversal pattern. Hidden divergence, which points to trend continuation, is covered in our MACD hidden divergence guide; the same logic applies to RSI.
First, what RSI actually averages
J. Welles Wilder Jr. introduced RSI in his 1978 book New Concepts in Technical Trading Systems. The standard length is 14 bars:
- For each bar, the gain is the close-to-close rise (or 0), and the loss is the close-to-close fall (or 0).
- The first average gain and average loss are simple averages of the first 14 bars. After that, each is updated with Wilder’s smoothing: new average = (previous average × 13 + current value) ÷ 14.
- RS = average gain ÷ average loss, and RSI = 100 − 100 ÷ (1 + RS).
TradingView’s RSI reference implements this with its rma() function, which is the same smoothing (an exponential average with weight 1/14 on the newest bar). The page also notes Wilder’s 70/30 overbought and oversold levels and that Wilder treated divergence as a reversal signal, while Andrew Cardwell later argued divergence more often marks a correction within the existing trend. Keep that disagreement in mind: even the people who popularised the tool did not agree on what it means.
The practical consequence of Wilder smoothing is that RSI reacts to the size of recent moves, not just their direction. A second low reached by a slow grind has small recent losses, so RSI stays higher, even if price is lower. That is the mechanical source of most bullish divergences.
The worked case (illustrative 4-hour ETH/USDT)
All numbers below are invented to show the mechanics.
| Swing low A | Swing low B | |
|---|---|---|
| Close at the low | 2,350 | 2,318 |
| Average gain (Wilder, 14) | 12 | 21 |
| Average loss (Wilder, 14) | 38 | 33 |
| RS | 0.316 | 0.636 |
| RSI | 24.0 | 38.9 |
Price made a lower low (2,318 below 2,350) while RSI made a higher low (38.9 above 24.0): regular bullish divergence. Notice why. The drop into low A was fast and one-sided, with large average losses and almost no gains. The decline into low B was choppier: the bounce in between raised average gains and diluted average losses. RSI is telling you the second leg down was less forceful, not that buyers have taken control.
Also notice where low B sits: RSI 38.9 is not oversold by Wilder’s 30 line. Many valid divergences have the second low above 30. Requiring both lows below 30 is a filter some traders use, not part of the definition.
Turning it into a trade plan
A divergence is a condition, not an entry. Here is one complete plan, written down before the entry bar:
- Confirm the pivot. Low B only counts as a swing low once, for example, three later candles have closed above it. Until then, it is just the latest bar.
- Trigger: a 4-hour close above the high of the bounce between A and B, here 2,440. That is price showing a change in structure, which RSI cannot show by itself. Our market structure guide calls this a change of character.
- Stop: below low B, at 2,310. Distance = 2,440 − 2,310 = 130.
- Size: with $100 at risk (1% of a $10,000 account), size = 100 ÷ 130 ≈ 0.769 ETH, about $1,877 notional.
- First target: the level where the decline last broke down, say 2,690. Distance 250, about 1.9R. Our risk-to-reward guide shows what win rate a 1.9R plan needs to break even (about 34% before costs).
What changes if…
…the next bar falls another $40 instead of bouncing?
Average gain becomes 21 × 13 ÷ 14 = 19.5 and average loss becomes (33 × 13 + 40) ÷ 14 = 33.5. RSI = 100 − 100 ÷ (1 + 19.5 ÷ 33.5) ≈ 36.8. Price is now at 2,278, a new low, and RSI is still well above 24. The divergence is “still there”, but low B was never confirmed and the trigger never fired. A trader who bought on the divergence alone is now underwater with no structural stop.
…the next bar falls $150?
Average loss becomes (33 × 13 + 150) ÷ 14 ≈ 41.4, and RSI drops to about 32.0. Price is at 2,168, 150 below low B, yet RSI is still higher than at low A. This is the core weakness of divergence: because Wilder smoothing gives each new bar only 1/14 of the weight, RSI can keep printing “higher lows” through a substantial further decline. Divergence can stack two or three times before any reversal, or never resolve into one.
…you look at the same setup on the 15-minute chart?
Each RSI bar now covers 15 minutes instead of 4 hours, so divergences appear far more often and last minutes, not days. Any 4-hour downtrend contains many 15-minute bullish divergences. Without a higher-timeframe filter, you would be buying every pause in a falling market.
…the market is a strong trend rather than an exhausted one?
In a powerful trend, RSI can stay pinned near an extreme while each new push is smaller in RSI terms simply because the moves are steadier. The resulting bearish divergences at the highs (higher price high, lower RSI high) can repeat for weeks. This is where Cardwell’s reading, a correction rather than a reversal, tends to fit better.
Common mistakes
- Drawing divergence from bars you could not have known were pivots. Many indicators draw lines back onto the pivot bar after the fact, which makes history look cleaner than live trading.
- Comparing wicks on price with closes on RSI. RSI uses closes by default. Use closing lows on the chart too, or note clearly that you are comparing wicks.
- Treating the divergence as the stop reference. The stop belongs below the price low, where the idea is proven wrong.
- Counting RSI, Stochastic RSI and MACD divergence as three confirmations. They are calculated from the same closes. See our Stochastic RSI guide for how closely related these are.
- Fighting a bigger trend. A bullish divergence on the 4-hour chart inside a daily downtrend is a counter-trend trade, and should be sized and targeted that way.
Test it on your own data
- Write the definition first: RSI length, pivot rule (for example, 3 bars each side), whether you compare closes or wicks, the trigger, the stop, and the target.
- Use TradingView’s Bar Replay on a pair and timeframe you trade. Step forward bar by bar and log a divergence only on the bar where your pivot rule confirms it.
- For every logged case, record: both lows, both RSI readings, whether the trigger fired, and the result in R. Include the cases where the trigger never fired, and note how far price fell after the divergence appeared.
- After 30 or more cases, compare against a baseline with the same trigger and stop but no divergence condition. If the divergence does not improve results after fees, it is decoration.
To check the arithmetic, export candles to a spreadsheet, compute the gains and losses column, seed the averages with a 14-bar simple average, then apply (previous × 13 + current) ÷ 14. After a few hundred bars, your RSI should match the chart to within a fraction of a point. Small differences early on come from the seed.
Financial disclaimer: This article is for educational purposes only and is not financial, investment, or trading advice. Trading involves substantial risk of loss. Example figures are illustrative.
2 thoughts on “RSI Divergence Strategy for Crypto: A Worked Reversal Case”