
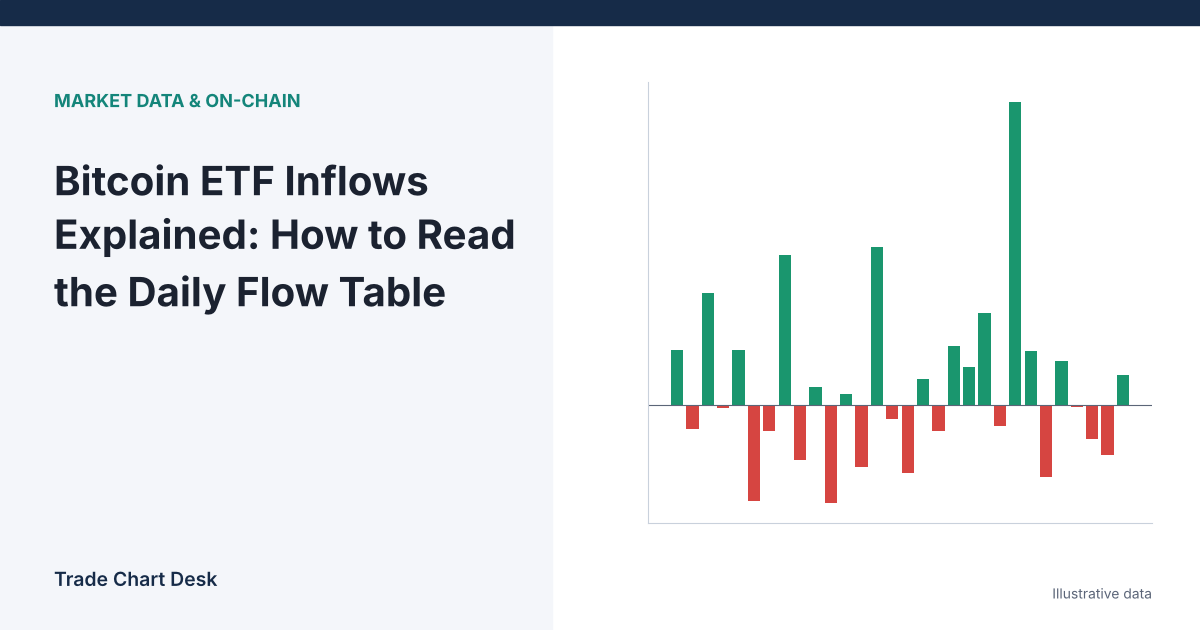
Most evenings, someone posts a headline like “Spot bitcoin ETFs see $500 million in inflows.” It sounds like a direct measure of institutions buying bitcoin. It is partly that, and partly something else. To use flow data well you need to know where the number comes from, when it arrives, and what it cannot tell you. This guide walks through a flow table row by row.
Where the “flow” number comes from
A US spot bitcoin ETF does not create new shares every time someone buys on the stock exchange. Most trading is just investors swapping existing shares with each other, and that does not change what the fund holds. Fund size changes only through the creation and redemption process:
- An authorized participant (a large broker-dealer with an agreement with the fund) asks the fund to create a block of new shares. The fund receives cash or bitcoin and adds bitcoin to its holdings. That is an inflow.
- For a redemption, the authorized participant returns shares and the fund releases cash or bitcoin. That is an outflow.
When the SEC approved the first 11 spot bitcoin exchange-traded products on January 10, 2024, creations and redemptions were limited to cash. On July 29, 2025, the SEC approved in-kind creations and redemptions for crypto ETPs, meaning authorized participants can now deliver or receive bitcoin directly. This matters for interpretation: an in-kind creation adds bitcoin to the fund without the fund buying anything on the open market, because the authorized participant sourced the coins elsewhere.
The arithmetic
Flow trackers estimate a day’s net flow from the change in shares outstanding, valued at that day’s net asset value (NAV, the per-share value of the fund’s holdings):
Net flow ≈ (shares outstanding today - shares outstanding yesterday) × NAV today
CFRA describes this method in its guide to analyzing ETF flow trends. Morningstar uses an equivalent formula that removes the effect of price changes on existing assets.
Worked example (illustrative numbers):
- Shares outstanding move from 200,000,000 to 204,000,000: a change of 4,000,000 shares.
- NAV is $46.00 per share.
- Net flow ≈ 4,000,000 × $46.00 = $184 million.
Fund assets rose from $9.0 billion (200M × $45.00 the day before) to $9.384 billion, an increase of $384 million. Only $184 million of that was new money. The other $200 million was price appreciation on bitcoin the fund already held. Headlines about “assets under management hitting a record” often mix the two.
To convert flow into bitcoin, divide by bitcoin’s price at the fund’s valuation time. At an illustrative $80,000, $184 million is 2,300 BTC. For scale, the protocol currently issues 3.125 BTC per block, roughly 144 blocks a day, or about 450 BTC per day. Comparisons like “ETFs bought five days of mining supply” come from that arithmetic, which also explains why they can be misleading: the bitcoin may come from existing holders, not from new supply.
Reading a flow table, column by column
The most-cited public table is from Farside Investors, which publishes a daily bitcoin ETF flow table in US$ millions, with outflows in parentheses. Here is how to read it:
| Part of the table | What to look at |
|---|---|
| Ticker columns (IBIT, FBTC, BITB, ARKB, GBTC and others) | Which funds drove the total. A large total from one fund is different from broad participation across many. |
| Fee row | Expense ratios. Persistent outflows from a higher-fee fund alongside inflows to cheaper ones can be switching, not net selling. |
| Total column | The day’s net sum across funds. |
| Blank or dash cells on the latest row | Not yet reported. A partial total is not a final number. |
Other trackers, such as SoSoValue, and on-chain analytics providers publish similar tables. Totals can differ slightly between sources because of reporting timing and revisions.
When the number arrives, and why that matters
US ETFs trade on US market days. Issuers publish the day’s shares outstanding after the close, and trackers fill in their tables as each fund reports. Some funds report late, and recent days can be revised. Meanwhile bitcoin trades on crypto exchanges 24 hours a day, seven days a week.
That timing creates a practical problem. By the time you read “Tuesday: +$500M,” Tuesday’s price move has already happened, and so has part of Wednesday’s Asian session. Flow data describes what fund investors did; it is not a live order book. Weekends have no ETF flows at all, even though bitcoin often moves on weekends.
Five ways to misread flows
- Treating flow as cause. Inflows often follow price strength, because investors buy what has risen. A big inflow day after a rally may be a reaction to price, not the reason for it.
- Ignoring hedged demand. Some creations come from funds running a basis trade: long ETF shares, short CME futures, earning the spread. That is not a directional bet on bitcoin, and the position can be unwound quickly when the spread narrows. Our piece on spot vs. futures delta neutrality explains the structure.
- Reading one day. Single-day flows are noisy. A five-day or ten-day rolling sum says more about direction than any single print.
- Forgetting scale. Even a large day can be under 1% of total ETF assets. Compare flows to total holdings, not just to yesterday.
- Calling it “institutional.” ETF shares are held by advisers, hedge funds, retail brokerage accounts and others. Flows tell you that fund investors in aggregate bought or sold, not who they were. Quarterly 13F filings give partial ownership detail, but with a long delay.
A weekly routine for using flow data
Here is a simple procedure that keeps flows in their proper role as context:
- Each Friday, sum the week’s net flows from one source and record it with total ETF bitcoin holdings and bitcoin’s weekly close.
- Compute the flow as a percentage of holdings. Example: +$1.2 billion on $100 billion of assets is 1.2% for the week.
- Note concentration. What share of the total came from the largest single fund?
- Check the basis. If CME futures traded at an unusually wide premium to spot that week, some inflow may be hedged.
- Compare with on-chain data. Exchange balances and large transfers give a second view of supply. See our guide to exchange inflow spikes.
After a few months, test your own hypothesis instead of a headline one: did weeks with strong net inflows tend to be followed by up weeks, or did they mostly follow up weeks? Shift the price column one week forward and back and compare. If the relationship is mostly backward-looking in your data, flows are telling you about sentiment, not about what comes next.
What flow data is good for
Used carefully, flows answer a narrow but real question: is demand from regulated US fund investors growing, steady or shrinking? Sustained multi-week outflows during a price decline say something different from a single red day. Broad inflows across many funds say something different from one fund absorbing switches from another. Combine that with price structure and your own risk rules, and it becomes useful background. Used as a buy or sell trigger, it mostly tells you what already happened.
Financial disclaimer: This article is for educational purposes only and is not financial, investment, or trading advice. Trading involves substantial risk of loss. Example figures are illustrative.
1 thought on “Bitcoin ETF Inflows Explained: How to Read the Daily Flow Table”