
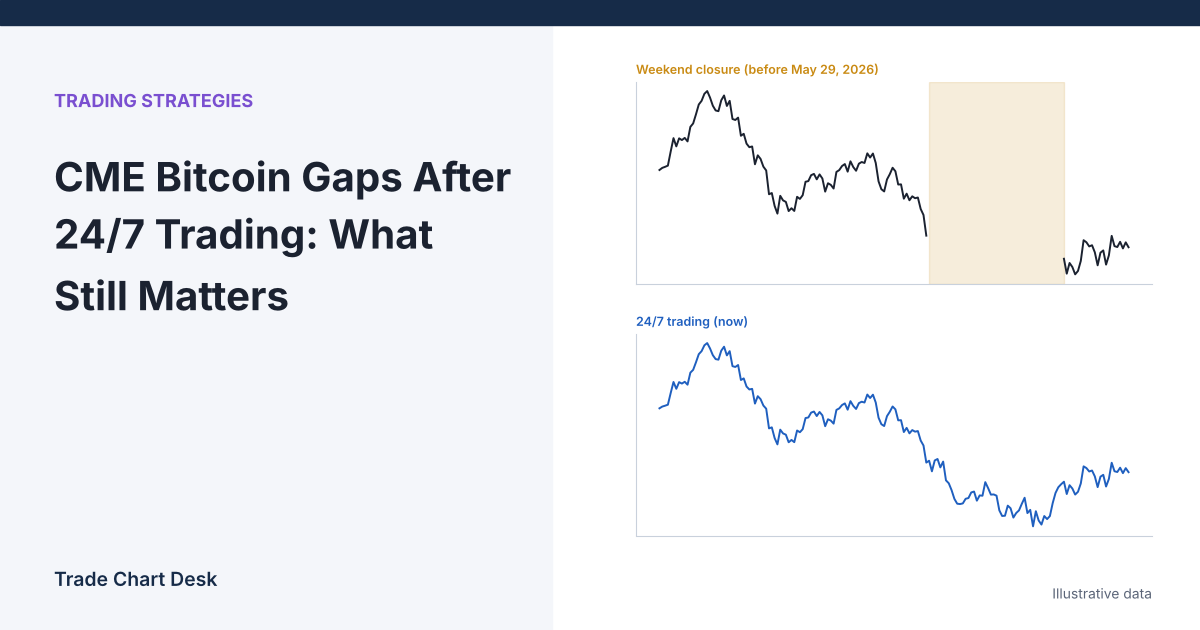
For years, “the CME gap” was one of the most repeated ideas in Bitcoin trading: CME futures closed on Friday, spot Bitcoin kept trading all weekend, and when futures reopened on Sunday evening the chart showed an empty space that traders expected price to come back and “fill.” That premise has changed. CME moved its cryptocurrency futures and options to round-the-clock trading on May 29, 2026. This article explains what the weekend gap was, why it formed, what is different now, and how to handle the old gaps still visible on your chart.
What changed, and when
CME announced its plan in October 2025, and in a June 1, 2026 press release confirmed that 24/7 trading for its cryptocurrency futures and options went live on Friday, May 29, 2026. Bitcoin Volatility futures followed on June 1. The exchange’s 24/7 trading page lists the practical details:
- It covers all CME crypto futures and options except the Spot-Quoted futures.
- There is still a short daily maintenance window on CME Globex, Monday to Friday from 4:00 to 4:02 p.m. Central Time, and a two-hour weekly window on Saturday from 2:00 to 4:00 a.m. Central Time.
- Trades executed from Friday evening through Sunday evening receive the trade date of the next business day, and clearing and settlement for them happen on that day too.
So the market no longer shuts for the weekend. The roughly 49-hour Friday-to-Sunday pause that created the classic gap is gone.
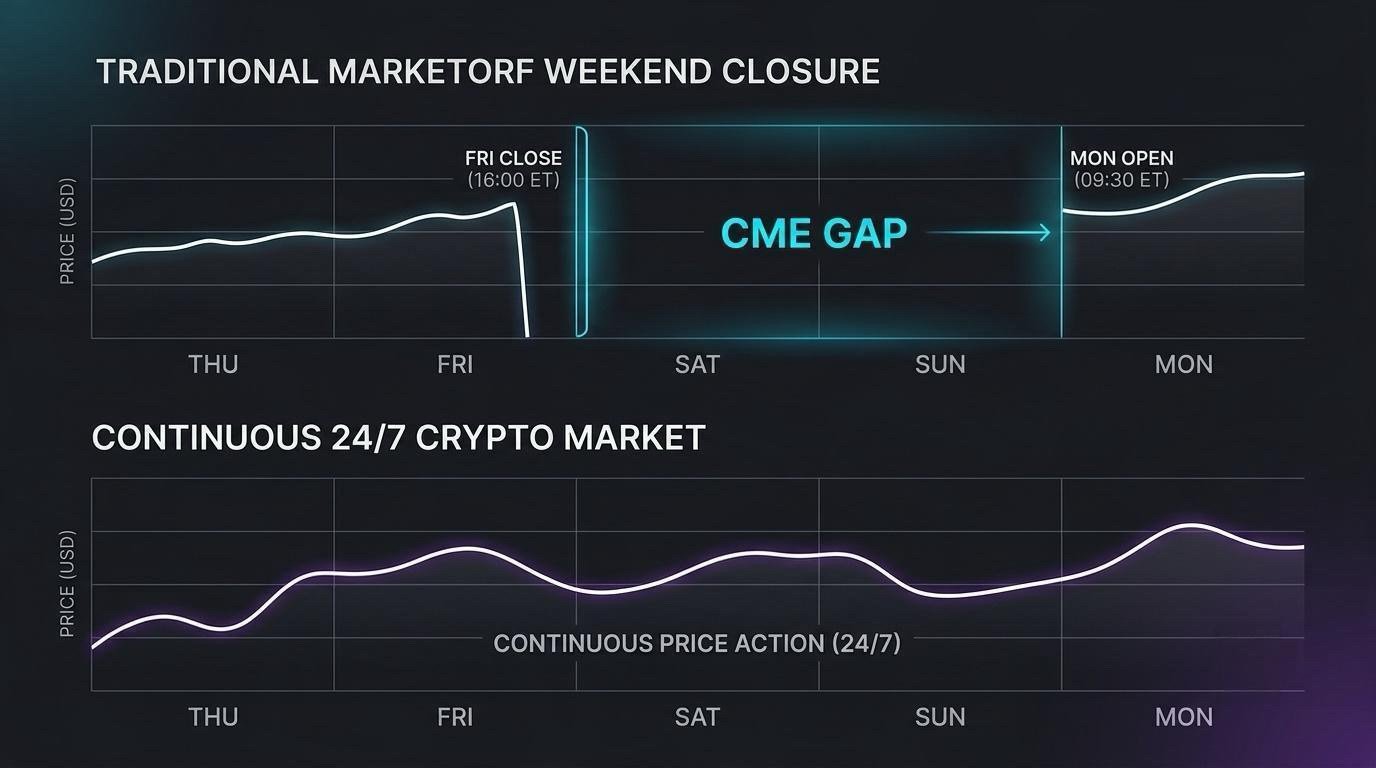
Why the gaps used to form
Before the change, CME Bitcoin futures traded Sunday to Friday, 6:00 p.m. to 5:00 p.m. Eastern Time, with a daily one-hour break, according to CME’s own FAQ. The spot market never stopped. If spot Bitcoin moved several percent over the weekend, the first CME print on Sunday evening reflected that move, and the futures chart showed a jump with no trades in between.
Here is the arithmetic with illustrative numbers:
| Event | Price |
|---|---|
| CME front-month last trade, Friday | $67,150 |
| Spot moves over the weekend | Up about $1,300 |
| CME first trade, Sunday evening | $68,400 |
| Gap | $67,150 to $68,400, a $1,250 range (about 1.9%) |
“Filling” the gap meant CME futures later traded back down to $67,150. Traders watched these levels because they were visible, many people watched them, and Bitcoin often revisits recent prices. None of that made the gap a magnet. It was simply an untraded price range on one venue’s chart.
Gaps that can still appear
24/7 trading removes the weekend closure, but a chart can still show discontinuities. Know which kind you are looking at.
Maintenance-window gaps
The Saturday window is two hours. If spot moves sharply during it, the first trade afterward can print away from the last one. Two hours is far shorter than a weekend, so these gaps should usually be small, but they are not impossible. The weekday two-minute window is unlikely to matter on most charts.
Thin-liquidity jumps
CME reported more than 7,200 crypto futures and options contracts traded over the first 24/7 weekend, about $50 million notional. That is small next to weekday activity. In a thin book, a one-minute or five-minute chart can show jumps between trades without any closure. These are liquidity gaps, not session gaps, and they behave differently.
Roll gaps on continuous charts
This is the one most traders still misread. Each CME Bitcoin futures contract expires (trading ends on the last Friday of the contract month, settling to the CME CF Bitcoin Reference Rate). A continuous chart such as TradingView’s BTC1! stitches contracts together, switching to the next month near expiry. Because the next contract usually trades at a different price (its basis), the switch can create a jump that no one ever traded through.
Illustration: the expiring contract closes at $62,000; the next month trades at $62,450 because of a $450 premium. The continuous chart jumps $450 at the switch. If a level of $62,800 was marked on the old contract, the equivalent level on the new contract is roughly $63,250. Anyone “waiting for the gap to fill” across a roll is waiting for a price difference that was created by the stitching, not by the market.
TradingView lets you remove this with back-adjustment (the B-ADJ button or “Adjust for contracts changes” in chart settings), which shifts older data by the price difference at each switch. Turn it on and see whether a given “gap” disappears. If it does, it was a roll gap.
What to do with old unfilled gaps
Charts still show weekend gaps from before May 29, 2026, and some have never been traded through. A sensible way to treat them:
- Confirm which chart created it. Is it on a specific contract, or on a continuous chart? With back-adjustment on or off? A gap that only exists on one setting is a display artifact.
- Translate it to spot. The gap is a CME futures price. Spot and perpetual futures on crypto exchanges trade at different prices because of basis and funding. If you plan around a gap level on a spot chart, note the difference at the time you mark it.
- Treat it like any other prior level. An old gap edge is a price where a lot of traders have a line drawn. That makes it a possible reaction area, ranked the same way as any other zone. Our guide to identifying key support and resistance gives a scoring method.
- Do not build a thesis on “it must fill.” No new weekend gaps are being created, so the old pattern has no fresh sample. A level that was unfilled for months may stay unfilled.
Misreadings to avoid now
- Calling any chart jump a “CME gap.” After May 29, 2026, a jump is most likely a roll, a maintenance window, or thin trading. Each has a different cause.
- Mixing trade dates and clock time. Weekend trades are booked to the next business day. Daily bars built on trade date can look different from bars built on calendar days. Check how your data vendor builds daily candles for this market.
- Quoting old fill-rate statistics. Fill-rate figures circulating online are typically unsourced and, in any case, describe a market structure that no longer exists.
- Assuming weekend moves are now “fair.” The weekend market is open but thin. Weekend price action on CME can be noisier than on weekdays, just without a visible gap. Positions held over weekends still need sizing that respects that; see position sizing.
Check it yourself
- Open
BTC1!on TradingView on a 1-hour chart and scroll to any weekend before late May 2026. You should see the Friday close and Sunday open with nothing between them. - Scroll to any weekend after May 29, 2026. Bars should now continue through Saturday and Sunday, with at most a short gap around the Saturday maintenance window.
- Find the switch date near a contract expiry. Toggle B-ADJ and watch whether the jump disappears.
- For each old gap you have marked, record which contract it came from and the spot-futures difference on the day. If you cannot fill in those two fields, the level is not well defined.
The broader lesson carries over to other derivatives topics such as mark, last and index price: always know which price series a level comes from before you trade it.
Financial disclaimer: This article is for educational purposes only and is not financial, investment, or trading advice. Trading involves substantial risk of loss. Example figures are illustrative.