
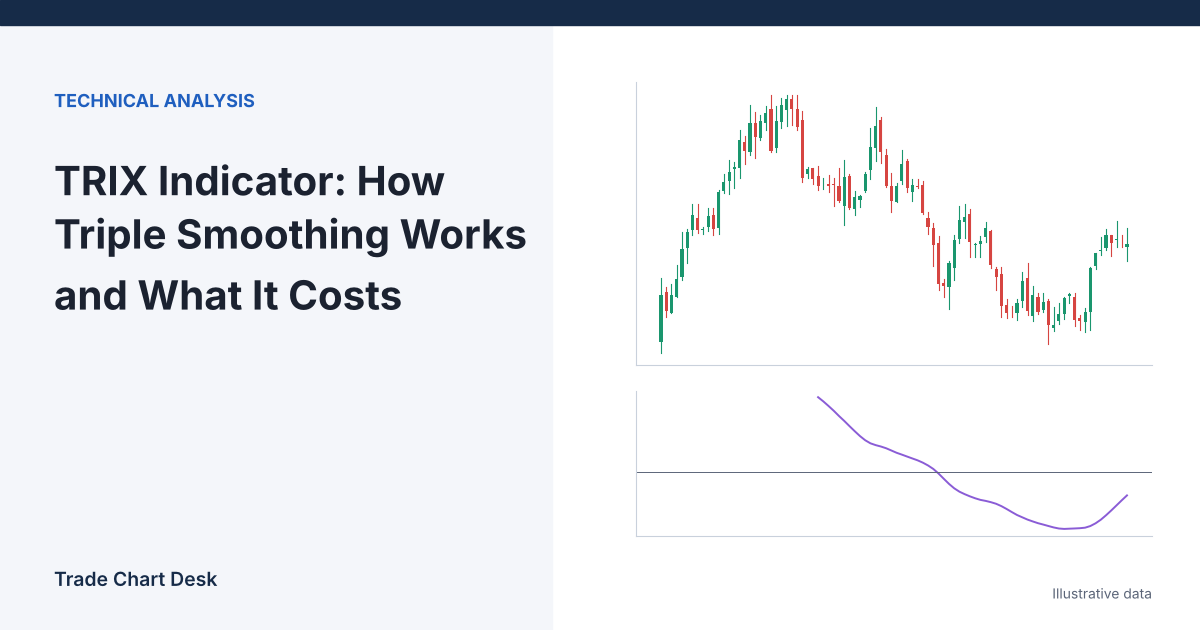
TRIX draws one of the cleanest lines you can put under a chart. It rarely wiggles, and it turns gradually. That smoothness is the whole selling point, and it is paid for in a currency many traders do not count: bars of delay. This article explains exactly how TRIX is built, why two platforms can show you numbers that differ by a factor of 100, and how to measure the delay on your own settings before you trade a single TRIX signal.
The recipe
TRIX was introduced by Jack Hutson, an editor of Technical Analysis of Stocks & Commodities, in the early 1980s. TradingView’s TRIX help page describes it in four steps, using 18 periods, which is also the length TradingView’s built-in indicator loads with:
- EMA1 = 18-period EMA of the close
- EMA2 = 18-period EMA of EMA1
- EMA3 = 18-period EMA of EMA2
- TRIX = one-bar percent change of EMA3
So TRIX is not a moving average of price. It is the slope of a triple-smoothed moving average. When TRIX is positive, the smoothed line is rising. When it is negative, it is falling. When TRIX crosses zero, the smoothed line has just made a turn.
Many traders add a signal line, an EMA of TRIX itself (9 periods is a common choice, but it is not universal and some platforms do not draw one by default).
The units problem: 0.05 or 5?
Suppose EMA3 moves from 2,500.00 to 2,501.25 in one bar. The one-bar percent change is 1.25 / 2,500 × 100 = 0.05.
Some implementations instead calculate 10,000 × the change in the natural log of EMA3 (the open-source TRIX built into TakeProfit’s Indie library, for example, takes the log of the close before smoothing and multiplies by 10,000). For the same move, that gives 10,000 × ln(2,501.25 / 2,500) ≈ 5.0. The line has the same shape and crosses zero at the same place, but every value is about 100 times larger.
This matters as soon as you copy a threshold from someone else. “Only take signals when TRIX is above 0.1” means very different things on the two scales. Before using any number, check your platform’s documentation or open the indicator source and see whether it multiplies by 100 or by 10,000.
What the smoothing costs: a lag measurement
Each EMA of length n uses a smoothing factor of 2 / (n + 1). Stacking three of them adds their delays together. Rather than quote a rule of thumb, here is a measurement on synthetic data you can reproduce: a price series that falls 0.3% per bar for 200 bars, then rises 0.3% per bar. The turn is perfectly sharp and there is no noise, which is the best case for any lagging indicator.
| TRIX length | Bars from the price low until TRIX crosses above zero | Price gain from the low by then |
|---|---|---|
| 9 | 12 | 3.66% |
| 12 | 16 | 4.91% |
| 15 | 20 | 6.17% |
| 18 | 24 | 7.45% |
| 30 | 40 | 12.73% |
At the default 18, the zero-line cross arrived 24 bars after the low. On daily bars that is more than three weeks. On this clean V, about 7.5% of the move was already done. Real price is noisier, which usually makes the confirmation later, not earlier. For comparison, a standard MACD (12, 26) zero-line cross on the same series came 16 bars after the low.
Notice the pattern: the delay is roughly 1.3 times the length. That is a useful sanity check when choosing a setting. If you want a zero-line signal within about 10 bars of a turn, a length near 18 cannot give it to you.
Signals, ranked by how late they arrive
| Signal | What it means mechanically | Timing |
|---|---|---|
| TRIX turns up or down (slope change) | The smoothed line’s rate of change has started to change | Earliest of the three, and the most prone to small, meaningless turns in choppy markets |
| TRIX crosses its signal line | TRIX has moved away from its own recent average | Middle. On the clean V above, it came within a bar or two of the low because TRIX began rising almost immediately. On noisy data it fires far more often. |
| TRIX crosses zero | The triple-smoothed average has actually turned | Latest. TradingView’s help page itself notes zero-line crosses carry a lot of lag and are not always reliable. |
| Divergence | Price makes a new extreme, TRIX makes a smaller one | Depends on how you define swings. Needs a confirmation rule or it is just an observation. |
The practical takeaway is that you choose between early-and-noisy and late-and-clean. TRIX does not escape that trade-off; it just lets you choose where on it you sit.
Where TRIX fails
Sideways markets
When price chops in a range, EMA3 flattens and TRIX hugs zero. Small wiggles produce repeated signal-line and zero-line crosses that each look meaningful. This is the regime problem covered in our trend-following vs. mean-reversion guide: TRIX is a trend tool and degrades in ranges. Pairing it with a trend-presence filter such as the Aroon indicator is one way to skip some of those periods.
Sharp reversals
A V-shaped crypto reversal, like the synthetic one above, is exactly where triple smoothing hurts most. By the time TRIX crosses zero, a large part of the move can be over, and your stop distance from the swing low is already wide. Account for that in your position sizing, since a late entry with a structural stop means a larger stop distance and therefore a smaller position for the same risk.
Short warm-up history
Three chained EMAs need a long history to settle. On a newly listed token with only a few dozen bars, the early TRIX values are mostly an artifact of where the calculation started.
Thresholds copied across platforms
As shown above, a level that works on one platform’s scale can be 100 times off on another.
TRIX compared with MACD and EMA crossovers
All three are built from exponential moving averages, so they answer similar questions with different trade-offs:
- An EMA crossover is the fastest and noisiest. It reacts to price crossing a smoothed line.
- MACD measures the gap between two EMAs. Its line moves more than TRIX, which makes it quicker but jumpier. Our MACD hidden divergence guide covers one way traders use that responsiveness.
- TRIX measures the slope of one heavily smoothed EMA. It is the calmest of the three and the slowest to confirm.
None is better in general. Which one fits depends on how long the trends you trade usually last compared with each indicator’s delay.
Measure the lag on your own market
- Pick five clear swing lows and five clear swing highs on your chart and timeframe. Mark them before adding TRIX.
- Add TRIX at your chosen length. For each swing, count the bars until (a) the signal-line cross and (b) the zero-line cross.
- Write down the price change from the swing to each cross, as a percentage.
- Now do the same over a sideways stretch of the same length and count how many crosses fired there.
- Compare: average delay at real turns versus number of false crosses in ranges. Change the length and repeat. Log everything in one table so you are comparing settings on the same swings.
If you want to reproduce the synthetic table, build the series in a spreadsheet, chain three EMA columns with the factor 2 / (n + 1), and take the one-bar percent change of the third. The zero-crossing bar should match the table above.
Financial disclaimer: This article is for educational purposes only and is not financial, investment, or trading advice. Trading involves substantial risk of loss. Example figures are illustrative.