
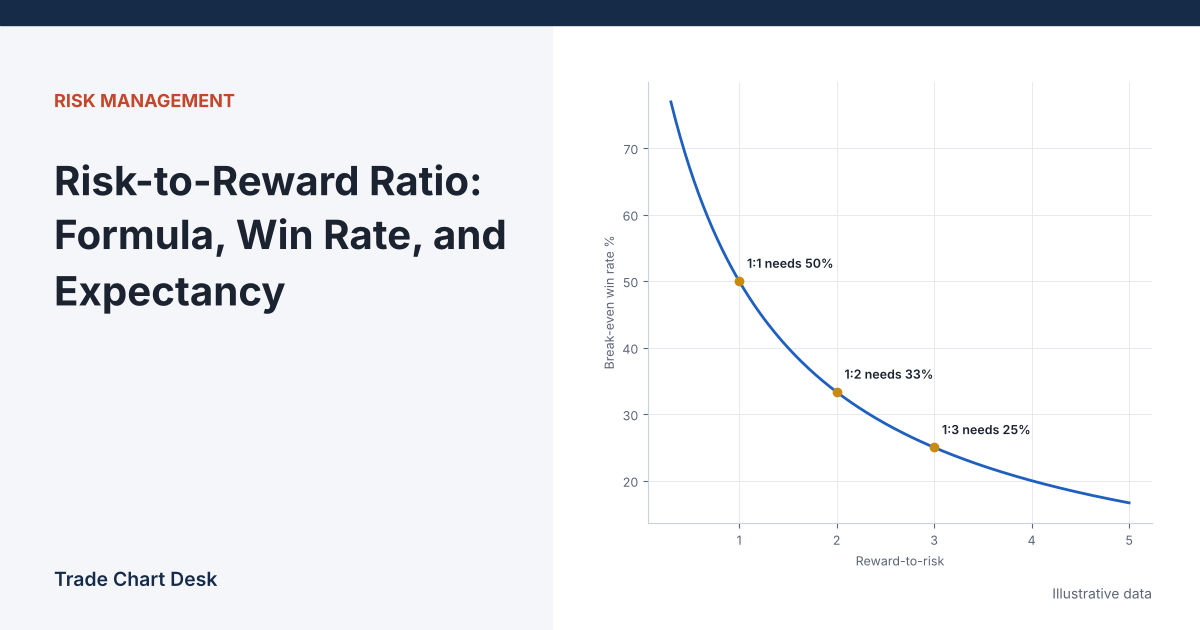
“Only take trades with at least 1:3 risk-to-reward” is one of the most repeated rules in trading. It is incomplete. A 1:3 trade that hits its target 15% of the time loses money, and a 1:1 trade that wins 60% of the time makes money. Risk-to-reward only means something next to a win rate, and the two together give you expectancy. This guide answers the questions traders actually ask about the ratio, with the arithmetic shown.
How do I calculate risk-to-reward?
For a long trade:
- Risk = entry − stop
- Reward = target − entry
- Reward-to-risk = reward ÷ risk
Illustrative example: BTC long at 60,000, stop at 59,100, target at 61,800. Risk = 900, reward = 1,800, so reward ÷ risk = 2. People write this as “1:2 risk-to-reward” or “2R.” For a short, flip the subtractions: risk = stop − entry, reward = entry − target.
The “R” notation comes from Van Tharp, who defined R as the initial risk on a trade and measured results as multiples of it. In his Technical Analysis of Stocks & Commodities article on system design, a trade risking $1,000 that makes $2,000 is +2R. Thinking in R lets you compare trades of different sizes and coins on one scale. The dollar value of 1R is set by your position size; see how to calculate position size from risk per trade.
Is “1:3” risk-to-reward the same as “3:1”?
Usually, yes, and the inconsistency confuses beginners. “Risk-to-reward 1:3” and “reward-to-risk 3:1” both describe risking 1 to make 3. Some platforms display it the other way round. The safe habit is to convert everything to R: “this trade is a 3R target.” Then there is no ambiguity.
What win rate do I need to break even?
If every winner makes R and every loser loses 1, the breakeven win rate is:
Breakeven win rate = 1 ÷ (1 + R)
| Target (R) | Breakeven win rate | Breakeven with 0.1R costs per trade |
|---|---|---|
| 0.5R | 66.7% | 73.3% |
| 1R | 50.0% | 55.0% |
| 1.5R | 40.0% | 44.0% |
| 2R | 33.3% | 36.7% |
| 3R | 25.0% | 27.5% |
| 4R | 20.0% | 22.0% |
The third column matters more than most guides admit. Fees, slippage and funding mean a winner nets a bit less than R and a loser costs a bit more than 1R. If those costs total c (in R) per trade, the breakeven win rate becomes (1 + c) ÷ (1 + R). For a 2R target with costs of 0.1R, that is 1.1 ÷ 3 = 36.7%. On tight stops, costs can easily be 0.1R or more, because fees scale with position size while R shrinks with the stop.
So how do I know if my trades are actually good? (Expectancy)
Real trades do not all hit the target or the stop. Some exit early, some slip. Expectancy averages what actually happened:
Expectancy (R per trade) = win rate × average win in R − loss rate × average loss in R
Tharp describes expectancy simply as the average R-multiple a system produces, which is the same thing computed directly from your trade list.
Worked example: ten journal entries (illustrative)
Results in R: +2.5, −1, −1, +1.8, −1, −0.4, +3.0, −1, −1.1, +0.6
- Total: +2.4R. Expectancy = 2.4 ÷ 10 = +0.24R per trade.
- Winners: 4 (40%), average +1.975R. Losers: 6 (60%), average −0.917R.
- Check: 0.40 × 1.975 − 0.60 × 0.917 ≈ 0.79 − 0.55 = 0.24R.
Two things the R:R rule alone would hide. First, the −1.1R trade is a stop that slipped; that cost is real. Second, the −0.4R trade was a manual early exit. Both pull the average loss away from exactly 1R, which is why measured expectancy beats a theoretical ratio.
At +0.24R, a trader risking $50 per trade would average about $12 per trade over a large sample. Ten trades is not a large sample: one more 3R winner or three more losers would change the conclusion. Treat anything under 30 to 50 trades as a hint, not a result.
Should I just aim for bigger targets?
Moving a target further away does not create edge by itself. A farther target is reached less often, so the win rate falls. Suppose a setup hits 2R 40% of the time (expectancy 0.40 × 2 − 0.60 × 1 = +0.20R). If stretching to 4R drops the hit rate to 18%, expectancy becomes 0.18 × 4 − 0.82 × 1 = −0.10R. The ratio doubled; the strategy got worse. The only way to know the real trade-off for your setups is to log where price went after entry. Many traders record the maximum favourable move (in R) on every trade for exactly this reason.
Targets should come from the chart, such as the next resistance, a measured move like the head and shoulders target, or a trailing exit. If the nearest logical target gives less than your minimum R, the honest choice is to skip the trade, not to move the target.
Why does my real R:R never match my plan?
- Stops slip, targets do not overshoot. A stop-market order can fill worse than its trigger; a limit target fills at your price or not at all. The asymmetry quietly lowers your average R.
- Early exits. Closing at +0.6R “to lock something in” turns planned 2R winners into small ones while losers still cost the full 1R.
- Moving the stop. Widening a stop after entry changes the trade’s R after the fact. If you trail stops, measure results against the initial risk; our trailing stop comparison shows how different trails change the final R on the same trade.
- Fees on small stops. As shown in the table, costs eat a bigger share of R as the stop tightens.
Does a positive expectancy mean I am safe?
No. Even with positive expectancy, losing streaks are normal. With a 40% win rate, the chance of any given run of 5 trades all losing is 0.65 ≈ 7.8%, and over hundreds of trades long streaks are close to certain to appear somewhere. That is why risk per trade is kept small: the system has to survive the streaks to reach its average.
How to measure your own numbers
- For every trade, record entry, initial stop, exit, and fees. Compute R = (exit − entry) ÷ (entry − initial stop) for longs, net of costs.
- Also record the maximum favourable excursion in R, so you can later see how often 1R, 2R and 3R were reached.
- After 30 or more trades per setup, compute win rate, average win, average loss and expectancy as above. Compare actual win rate with the breakeven column for your typical target.
- Review by setup, not just overall. A trading journal with a setup tag makes this a filter in a spreadsheet.
Financial disclaimer: This article is for educational purposes only and is not financial, investment, or trading advice. Trading involves substantial risk of loss. Example figures are illustrative.
4 thoughts on “Risk-to-Reward Ratio: Formula, Win Rate, and Expectancy”