
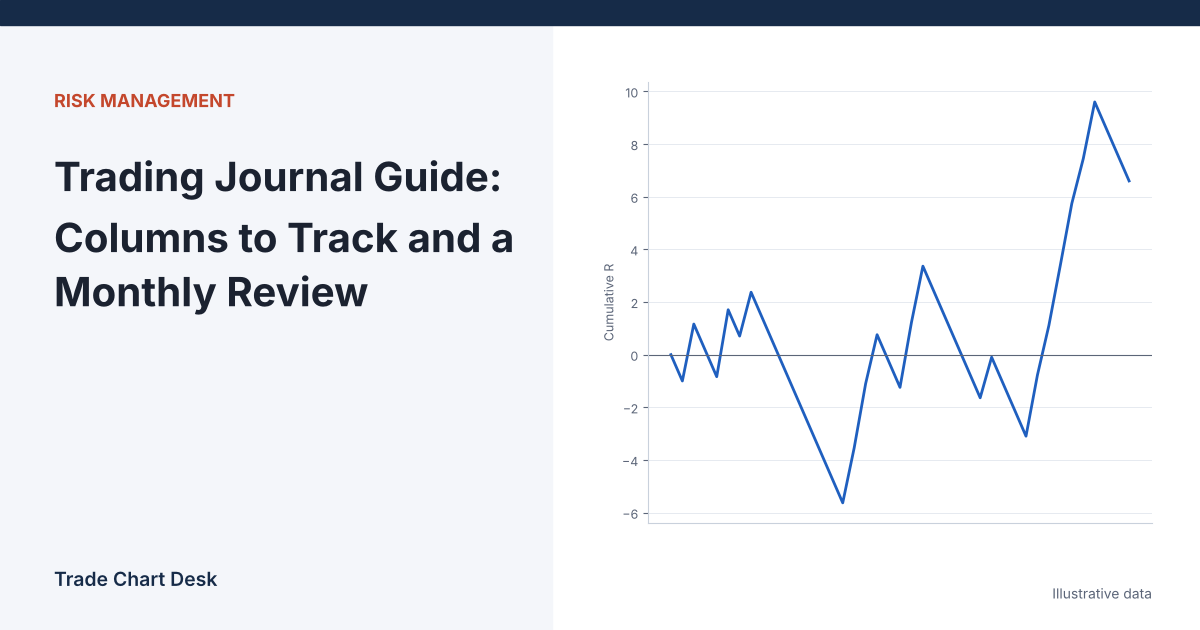
Most trading journals die in the third week. They start as a spreadsheet with thirty columns, the trader fills in half of them for ten trades, and the file is never opened again. A journal is only useful if it answers a question at the end of the month, so this guide works backward from the questions: first the review you will run, then the columns you need to run it, then a worked monthly review with twenty illustrative trades.
The three questions a journal should answer
- Does my setup have a positive expectancy when I follow my own rules?
- How much am I losing by not following them?
- Is my execution (entries, stops, fees) costing more than I think?
Everything you log should feed one of these. If a column does not, drop it.
The column set
Log the planning columns before you enter, and the result columns when the trade closes. Filling in the plan after the outcome is known quietly rewrites it.
| Column | When | Example | Why it is there |
|---|---|---|---|
| Trade ID | Before | 2026-10-07 | Links screenshots and notes |
| Date/time opened (UTC) | Before | 2026-10-07 14:00 | Session and weekday analysis |
| Market and venue | Before | ETH/USDT perp, exchange name | Fees and price differences vary by venue |
| Direction | Before | Long | Long vs. short results often differ |
| Setup tag | Before | Breakout-retest | Groups trades so each setup gets its own expectancy |
| Timeframe | Before | 1h | Same setup can behave differently by timeframe |
| Planned entry | Before | 2,600 | Measures slippage |
| Planned stop | Before | 2,550 | Defines 1R |
| Planned target (if any) | Before | 2,700 | Planned reward-to-risk |
| Risk in $ (1R) | Before | 50 | Converts results to R |
| Position size | Before | 1.0 ETH | Checks size matches risk |
| Actual entry / actual exit | After | 2,603 / 2,698 | Execution quality |
| Fees and funding ($) | After | 3.10 | Real cost per trade |
| Net P&L ($) | After | 91.90 | Raw result |
| Result in R | After | 1.84 | Net P&L ÷ planned risk; comparable across trades |
| Rules followed? (Y/N) | After | Y | Separates the system from the trader |
| Rule broken (if N) | After | Moved stop | Finds your most expensive habit |
| Screenshot link and one-line note | After | “Entered on retest close” | Lets you check the setup was really present |
Check the example row: a long from 2,603 to 2,698 on 1.0 ETH is 95.00 gross; minus 3.10 in costs is 91.90; divided by the planned $50 risk is 1.84R. Always divide by the planned risk, not the risk after a slipped entry, so bad fills show up as smaller R rather than disappearing.
If you trade from a U.S. tax perspective, keep the raw exchange exports too. The IRS digital assets page says taxpayers must keep records of each purchase, sale, exchange or other disposition. A performance journal is not a substitute for those records.
The monthly review, step by step
Set aside about an hour on the first weekend of each month. Work on closed trades only.
- Clean the data. Confirm every trade has a planned stop, a risk amount and an R result. Trades without a planned stop cannot be measured; count them separately and treat that count as a problem in itself.
- Compute the core numbers for all trades together:
- Win rate = winning trades ÷ total trades
- Average win (R) and average loss (R)
- Expectancy (R per trade) = win rate × average win + loss rate × average loss (average loss entered as a negative number). This equals total R ÷ number of trades.
- Profit factor = gross R won ÷ gross R lost
- Split by “rules followed.” Compute the same numbers for Y and N trades separately.
- Split by setup tag. Repeat for each setup with enough trades to be worth looking at.
- Check execution. Average slippage (actual minus planned entry, in R) and average fees per trade in R.
- Write one change for next month. One. Not a list.
A worked month: twenty illustrative trades
Results in R, in the order they were taken. Trades 5, 10, 14 and 19 were marked “rules followed: N.”
+2.1, −1, −1, +1.4, −1, −0.4, +3.0, −1, −1, +0.8, −1, +2.5, −1, −1.2, +1.0, −1, −0.5, +1.8, −1, −1
| Group | Trades | Win rate | Avg win | Avg loss | Expectancy | Total | Profit factor |
|---|---|---|---|---|---|---|---|
| All trades | 20 | 35% | +1.80R | −0.93R | +0.025R | +0.5R | 1.04 |
| Rules followed | 16 | 37.5% | +1.97R | −0.89R | +0.18R | +2.9R | 1.33 |
| Rules broken | 4 | 25% | +0.80R | −1.07R | −0.60R | −2.4R | 0.25 |
Check the first row: 7 wins totalling 12.6R (average 1.80R) and 13 losses totalling −12.1R (average −0.93R). Expectancy = 0.35 × 1.80 + 0.65 × (−0.9308) = 0.63 − 0.605 = +0.025R, which matches 0.5R ÷ 20 trades. Profit factor = 12.6 ÷ 12.1 = 1.04. At $50 per R, the month made $25 before anything else, which is essentially flat.
The split tells a different story. The sixteen trades taken by the rules averaged +0.18R. The four rule-breaking trades lost 2.4R between them, which wiped out most of the month. Trade 14 lost 1.2R because the stop was moved, and trade 10 was cut early at +0.8R when the plan called for a 2R target. The one change for next month writes itself: do not touch the stop after entry.
Why you should not trust these numbers yet
Sixteen trades is a very small sample. A few big winners or one bad week can swing expectancy from positive to negative. Treat any one month as a reading, not a verdict:
- Keep a rolling total across months and judge a setup only after roughly 30 to 50 trades with the same rules.
- Watch win rate and average win together. A rising win rate with a falling average win often means you have started taking profits too early. Our risk-to-reward and win rate guide shows how the two trade off.
- Expectancy in R is only meaningful if 1R is consistent. If risk per trade swings between 0.5% and 3% of the account, R results stop being comparable. See position sizing for keeping risk fixed.
Journals fail in predictable ways
- Too many columns. Start with the list above. Add a column only when a review raises a question you cannot answer.
- Logging only good trades. Every executed trade goes in, including the impulsive ones. Those are usually where the “rules broken” group comes from.
- Emotion fields with no use. A 1–5 “confidence” score is useful only if you later check whether high-confidence trades did better. If you never check, skip it. If impulse entries are your problem, see overcoming FOMO.
- Reviewing in the middle of a losing streak. Stick to the calendar. A review run because you are upset is usually a search for a new system.
Setting it up in a spreadsheet
With R results in column R and the rules flag in column S (rows 2 to 21), the core numbers are four formulas: win rate =COUNTIF(R2:R21,">0")/COUNT(R2:R21), average win =AVERAGEIF(R2:R21,">0"), average loss =AVERAGEIF(R2:R21,"<=0") and expectancy =AVERAGE(R2:R21). For the rules-followed group, use =AVERAGEIFS(R2:R21,S2:S21,"Y"). Paste the twenty trades above into a sheet and check that you get +0.025R and +0.18R before using it on your own data.
Financial disclaimer: This article is for educational purposes only and is not financial, investment, or trading advice. Trading involves substantial risk of loss. Example figures are illustrative.