
An EMA crossover is one of the first rules most chart traders learn: when a faster exponential moving average crosses a slower one, something about the recent trend has changed. The rule is easy to see on a chart, which is exactly why it is worth understanding properly. This guide shows how the EMA is calculated, why every crossover arrives late by design, where the rule tends to fail, and how to test it yourself before risking money on it.
What an EMA actually calculates
An exponential moving average updates itself with one simple formula on every new bar:
EMAtoday = EMAyesterday + α × (Pricetoday − EMAyesterday), where α = 2 ÷ (N + 1) and N is the period length.
For a 9-period EMA, α = 2 ÷ 10 = 0.20, so each new close moves the average 20% of the way toward that close. For a 21-period EMA, α = 2 ÷ 22 ≈ 0.091, so each new close moves it only about 9% of the way. TradingView documents the same calculation in its EMA reference.
A quick worked example
Suppose both the 9 EMA and the 21 EMA currently sit at 100, and the next candle closes at 105.
- 9 EMA: 100 + 0.20 × (105 − 100) = 101.00
- 21 EMA: 100 + 0.091 × (105 − 100) ≈ 100.45
The same price jump moved the fast line more than twice as far as the slow line. That gap is what eventually produces a crossover. Notice that neither line reached 105: both averages are still mostly made of older prices.
Why crossovers are always late
A useful way to think about lag is the “average age” of the data inside an EMA. For an EMA with smoothing factor α, the weighted average age of the prices it contains is (1 − α) ÷ α bars. That works out to:
| EMA length | α | Average age of data |
|---|---|---|
| 9 | 0.200 | 4 bars |
| 21 | 0.091 | 10 bars |
| 50 | 0.039 | 24.5 bars |
| 200 | 0.010 | 99.5 bars |
A 9/21 crossover therefore compares a line that is “centered” roughly four bars in the past with one centered roughly ten bars in the past. By the time the two lines cross, a meaningful part of the move has usually already happened. This is not a flaw that better settings can remove; it is the cost of smoothing. Shorter periods reduce lag but produce more false signals. Longer periods reduce noise but react later.
Bullish and bearish crossovers
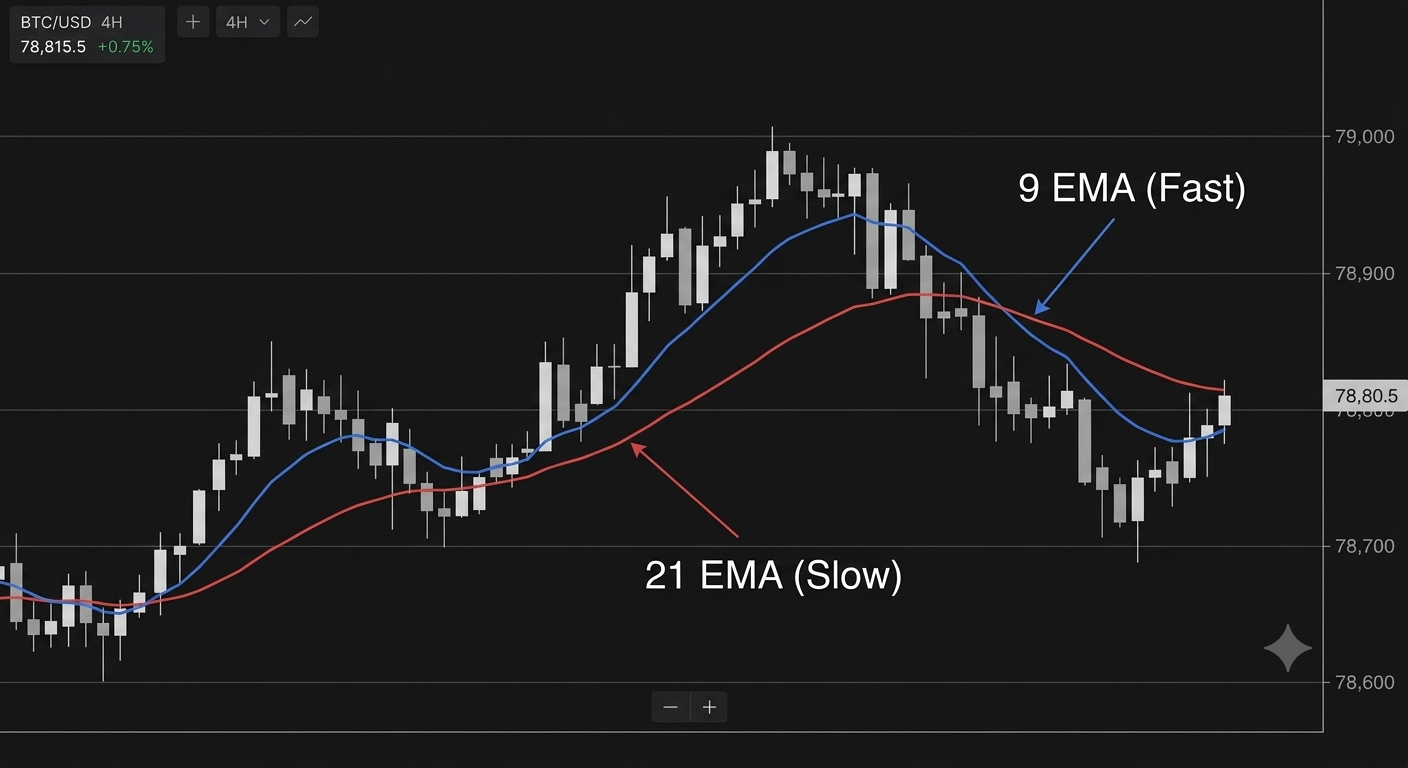
- Bullish EMA crossover: the faster EMA closes a bar above the slower EMA after being below it.
- Bearish EMA crossover: the faster EMA closes a bar below the slower EMA after being above it.
You will often see the terms “golden cross” and “death cross” used loosely. In most market commentary those names refer to the 50-day and 200-day moving averages, not to a 9/21 pair on an hourly chart. Using the precise term avoids confusion when you compare your notes with other sources.
Where the rule works and where it breaks
Crossover rules are trend-following rules. They tend to do their job in markets that travel a long way in one direction, and they tend to struggle in markets that move sideways.
The whipsaw problem, in numbers
In a sideways range, price keeps crossing back and forth through its own average, so the two EMAs cross back and forth too. Each round trip costs you something even if the loss on each trade is small. Consider a simple illustration with arbitrary numbers:
- You risk 1% of the account per trade (1R).
- Round-trip trading fees are 0.10% of position size.
- A sideways market produces five crossovers in a row that are each stopped out.
That sequence costs about 5R before fees, which is roughly 5% of the account. If the position size is several times the account (for example, through leverage), the fee drag grows with it. A single strong trend afterward may recover the losses, or it may not arrive at all. This is why a crossover rule should never be judged by the one clean trend you remember.
Common filters traders add (and their trade-offs)
| Filter | What it tries to do | What it costs |
|---|---|---|
| Wait for the candle to close | Ignore intrabar crosses that disappear before the close | Entry is later still |
| Higher-timeframe trend filter (e.g. only take bullish crosses when price is above the daily 200 EMA) | Avoid trading against the larger trend | Fewer trades; misses early reversals |
| Range breakout confirmation (enter only after price clears the recent high) | Reduce entries inside a range | Worse entry price; some trends start without a clean breakout |
| Minimum slope or separation between the EMAs | Ignore crosses where both lines are flat | Needs an extra parameter that can be over-fitted |
Every filter removes some bad trades and some good ones. Adding filters until your historical chart looks perfect is the fastest way to build a rule that fails on new data.
A complete rule set you can test
A crossover is an entry condition, not a trading plan. A testable plan needs every decision written down before you look at results. Here is an example template, not a recommendation:
- Market and timeframe: BTC/USDT, 1-hour bars.
- Entry: 9 EMA closes above 21 EMA, and the close is above the highest high of the previous 10 bars.
- Initial stop: below the lowest low of the previous 10 bars.
- Position size: account risk ÷ (entry − stop), so that a stop-out costs a fixed percentage of the account. Our position sizing guide walks through the arithmetic.
- Exit: the opposite crossover, or the stop, whichever comes first.
- Costs: include fees and an assumed slippage on every entry and exit.
How to test it yourself
You do not need to trust anyone’s claimed win rate, including ours. You can measure the rule on data you choose:
- Split your history. Pick an older period to develop the rule and a newer period you do not look at until the rule is fixed.
- Record every signal, not just the good ones. A spreadsheet with entry time, entry price, stop, exit, and result in R is enough.
- Measure more than win rate. Track average win and average loss in R, the longest losing streak, and the largest drawdown. A rule that wins 35% of the time can still be workable if winners are much larger than losers; a rule that wins 60% of the time can still lose money if losses are larger.
- Include costs. Re-run the numbers with fees and slippage. Fast settings on low timeframes are the most sensitive to this.
- Check different regimes. Look at a trending period and a ranging period separately. If the rule only works in one, you need a way to tell them apart in real time, which is harder than it sounds. Our comparison of trend following and mean reversion covers that problem in more depth.
If you use TradingView’s Strategy Tester, set commission and slippage in the strategy properties before reading any results, and be aware that historical bars can fill differently from live orders.
Five mistakes to avoid
- Acting on an unclosed cross. The lines can cross and uncross within the same bar.
- Changing the periods after every loss. That turns a rule into a curve-fit.
- Treating the opposite cross as a short signal by default. Exiting a long and opening a short are different decisions with different risks, including funding and liquidation on derivatives.
- Ignoring the timeframe. A 9/21 cross on a 5-minute chart and on a daily chart are completely different signals.
- Using leverage to make small moves feel worthwhile. Leverage multiplies the whipsaw cost described above.
What to remember
- An EMA moves a fixed fraction (2 ÷ (N + 1)) of the way toward each new price, so it always contains older data and always lags.
- Crossovers are trend-following signals: they help in long directional moves and bleed in sideways markets.
- Filters trade fewer bad signals for fewer good ones; none removes the trade-off.
- Write the full plan (entry, stop, size, exit, costs) before testing, and test on data you have not already looked at.
Financial disclaimer: This article is for educational purposes only and is not financial, investment, or trading advice. Trading cryptocurrencies and derivatives involves substantial risk of loss. Examples use illustrative numbers, not real trades or forecasts.
1 thought on “EMA Crossover Strategy for Beginners: How It Works, Why It Lags, and How to Test It”