
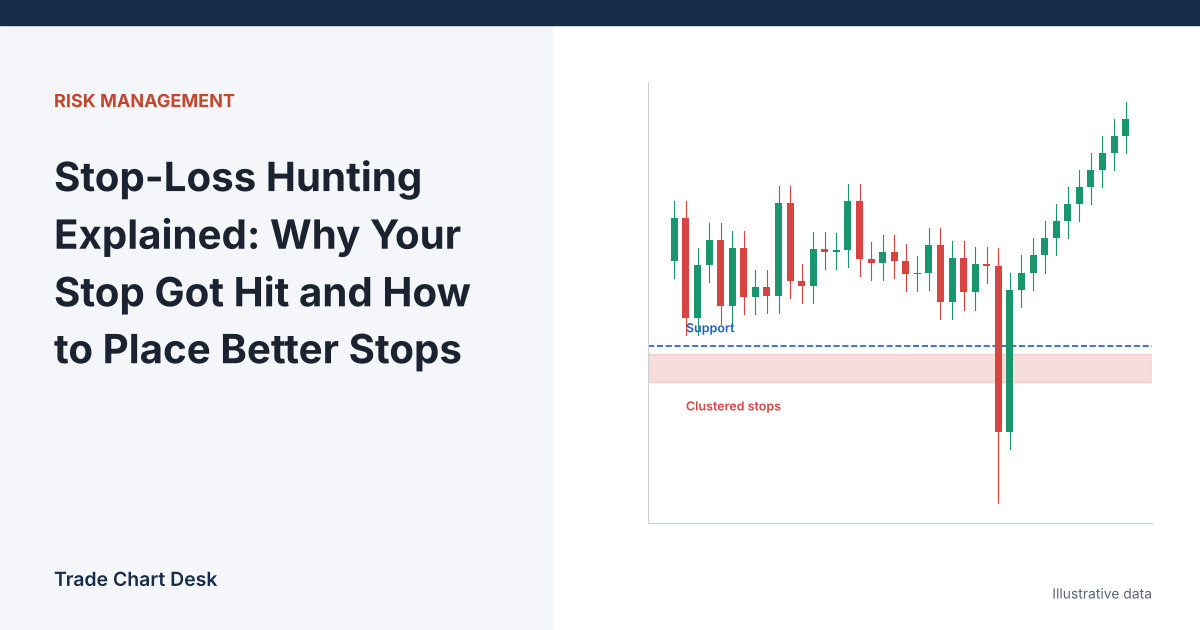
Almost every trader has watched price dip just far enough to trigger their stop, then reverse and move in the direction they expected. It feels deliberate. Sometimes large players do push price through obvious levels, but most stop-outs have more ordinary explanations. This guide explains how stop orders actually execute, why they cluster, how to diagnose what happened after a stop-out, and how to place stops that are harder to knock out by routine noise.
How a stop order actually works
A stop order sits dormant until a trigger price is reached. Then it becomes a live order:
- Stop-market: becomes a market order. It will almost certainly fill, but the fill price can be worse than the trigger, especially in fast markets.
- Stop-limit: becomes a limit order. It will not fill worse than your limit, but if price gaps past the limit it may not fill at all, leaving you in the position.
The U.S. SEC’s Investor.gov overview of order types explains this distinction for securities. Crypto exchanges follow the same basic logic but have their own rules, which you should check on your venue.
The crypto futures detail most traders miss: which price triggers your stop
On many crypto derivatives exchanges, you can choose whether a stop triggers on the last price (the most recent trade on that exchange) or the mark price (a smoothed fair-value estimate, usually derived from an index of prices across several venues). Binance Futures, for example, lets traders choose either trigger type for stop orders, and uses mark price for liquidations.
This matters because the two prices can diverge for a few seconds during a spike:
- If your stop uses last price, a brief spike on that single exchange can trigger it, even if other exchanges barely moved.
- If your stop uses mark price, it is less sensitive to single-venue spikes, but the actual fill still happens at the market price, which may differ from the mark.
- If you watch a last-price chart while your stop uses mark price (or the reverse), you may see a stop trigger at a level the chart never seemed to touch.
Our detailed explainer on mark price vs. last price vs. index price covers how each one is calculated.
Why stops cluster where they do
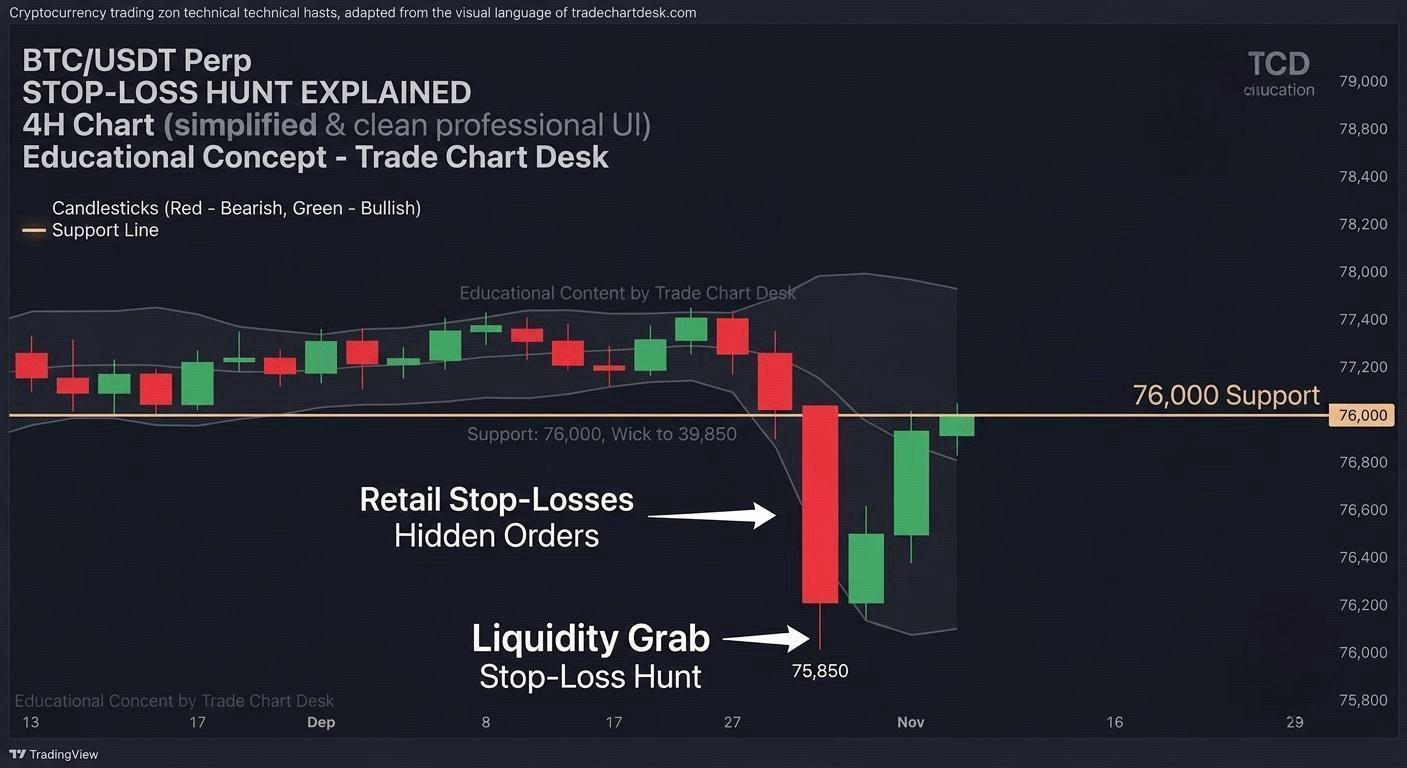
Many traders learn the same rules: stops go just below the recent swing low, below round numbers, or below a visible support line. That produces clusters of resting sell orders at predictable places. When price reaches a cluster, the triggered market orders add selling pressure, which can push price further and trigger the next group of stops. On leveraged markets, forced liquidations can add to the same cascade. Our guide to liquidation heatmaps shows how traders try to estimate where those levels sit.
Once the cluster is exhausted, there may be no more forced sellers below, and buyers who were waiting for lower prices step in. The result is the familiar “wick below support, then reversal.” This can happen without anyone planning it. It can also be exploited by participants who expect it. A price chart alone cannot tell you which.
After a stop-out: a five-question diagnosis
Instead of concluding “I got hunted,” work through these questions. They usually reveal something you can change.
- Which price triggered the stop, and where did it fill? Check your order history for trigger type, trigger price and fill price.
- Did other exchanges show the same move? If only your venue spiked, the issue was local liquidity or your trigger type, not the market.
- Was there news or a scheduled event? CPI releases, rate decisions and large token unlocks produce fast moves that look like hunts.
- How far was your stop compared with normal volatility? If your stop was smaller than the typical range of a single candle, ordinary noise was enough.
- Was your stop at the most obvious level? Exactly at a round number or one tick below a clean swing low is where everyone else’s stop is too.
Placing stops with ATR instead of guesswork
Average True Range (ATR) estimates the typical size of a bar’s movement, including gaps. It does not predict direction, but it gives a reference for how much noise to expect. TradingView documents the calculation in its ATR reference, and our ATR trailing stop guide covers how to use it once a trade is open.
Worked example with illustrative numbers
- Long entry: $76,000. The structural level that would invalidate the idea: support at $75,700.
- Current 1-hour ATR(14): $600.
- Stop rule: structure level minus 0.5 × ATR → $75,700 − $300 = $75,400. Alternatively, entry minus 1.5 × ATR → $76,000 − $900 = $75,100.
Using the second rule, the stop distance is $900. With a $10,000 account risking 1% ($100), position size = $100 ÷ $900 ≈ 0.111 BTC. If you had instead placed the stop a tight $150 below entry, the same $100 risk would allow 0.667 BTC, but a single average candle could trigger it.
The wider stop is not “safer” in dollar terms; the dollar risk is identical. What changes is how much routine movement the trade can absorb before being closed. Our position sizing guide explains the formula in more detail.
What not to do
- Don’t remove stops to “avoid being hunted.” That replaces a small, known loss with an unlimited one.
- Don’t widen the stop after entry. If the stop needs moving, the original plan was wrong; re-evaluate, don’t drift.
- Don’t keep size constant when widening the stop. That increases risk per trade without you noticing.
- Don’t add leverage to compensate for a wider stop. Liquidation can then arrive before your stop does.
- Don’t automatically re-enter after every sweep. Some breaks below support are real breakdowns.
Trading the sweep (if you want to)
Some traders try to use stop sweeps as entries: wait for price to break below support, then enter only if it closes back above the level. If you test this, define in writing what counts as a reclaim (for example, a close back above support within three bars), where the invalidation is (below the sweep low), and how you will size. Then log every occurrence. Sweeps that turn into genuine breakdowns are part of the result, not exceptions to ignore. Our article on order book imbalance and liquidity absorption covers what traders look for in the order flow during these moves.
Summary
- A stop-market order fills at the next available price; a stop-limit may not fill at all.
- On crypto futures, check whether your stop triggers on last price or mark price.
- Stops cluster at obvious levels, and triggered stops can drive price further on their own. A chart cannot prove intent.
- Size positions from an ATR- and structure-based stop, so routine noise does not decide your trades.
Financial disclaimer: This article is for educational purposes only and is not financial, investment, or trading advice. Trading cryptocurrencies and derivatives involves substantial risk of loss, including losses larger than expected due to slippage and leverage. All prices above are illustrative.
5 thoughts on “Stop-Loss Hunting Explained: Why Your Stop Got Hit and How to Place Better Stops”