
Here is a calculation that changes how most people read miner charts. Suppose miners send out exactly the same number of bitcoin every day for a year. If the price doubles over that year, a USD-based “miner outflow multiple” will show miners distributing far more than usual, even though they did not move a single extra coin. Several of the best-known miner metrics are measured in dollars against a 365-day average, so this is not a corner case. It is the first thing to check whenever someone posts a “miners are dumping” chart.
Miner flows share a problem with exchange inflow spikes and whale wallet alerts: one headline number can hide several different reasons for a transfer. This guide focuses on the parts that are specific to miners.
This guide starts from where miner coins come from, then works through that calculation and the other ways miner data misleads, and ends with a routine for checking a miner outflow claim yourself.
Where miner coins come from
Every new bitcoin enters circulation through the coinbase transaction of a block, paid to whoever mined it. Since the April 2024 halving the block subsidy is 3.125 BTC. With a target of one block every ten minutes, that is about 144 blocks a day:
3.125 BTC × 144 blocks ≈ 450 BTC per day, plus transaction fees.
That 450 BTC is the natural “supply” miners must either hold or sell. Most miners have electricity, hosting and debt costs payable in fiat, so a large share of new coins is sold in normal conditions. Outflows from miners are expected. The question is never “are miners selling?” but “are they selling more than they are producing, and more than usual?”
In practice most hashrate is pooled, and pools usually receive the coinbase reward and then distribute it to member miners. That is why analytics providers generally track flows from mining pool wallets and wallets linked to them rather than from individual miners.
What each miner metric measures
| Metric | Definition (provider) | Unit | Best question it answers |
|---|---|---|---|
| Miner reserve | BTC held in wallets the provider attributes to miners (CryptoQuant) | BTC | Are miners accumulating or drawing down their stock? |
| Miner outflow | BTC sent out of mining pool wallets (CryptoQuant) | BTC | How much left miner wallets today? |
| Miner to exchange flow | BTC sent from mining pool wallets to exchange wallets (CryptoQuant) | BTC | How much went somewhere it could be sold quickly? |
| Miners’ Position Index (MPI) | Miner outflow in USD relative to its 365-day moving average, expressed as a z-score in CryptoQuant’s formula | Ratio / z-score | Is today’s USD outflow unusual against the past year? |
| Miner Outflow Multiple | Miner outflow divided by its 365-day moving average, in USD (Glassnode) | Ratio | Same question; near 1 means in line with the trailing year |
Sources: CryptoQuant’s Miners’ Position Index documentation and its miner flow pages, and Glassnode’s mining metrics reference. CryptoQuant’s MPI page actually gives two descriptions (a simple ratio and a 365-day z-score of that ratio), so check which version a chart shows before comparing readings across sources.
The dollar trap, worked out
All figures below are illustrative.
- Over the past 365 days, miners sent out an average of 900 BTC per day. The average BTC price over that year was $60,000.
- 365-day average outflow in USD: 900 × $60,000 = $54 million per day.
- Today miners send out 900 BTC again, exactly their normal amount, but BTC now trades at $100,000.
- Today’s outflow in USD: 900 × $100,000 = $90 million.
- Outflow multiple: $90M ÷ $54M ≈ 1.67.
A reading of 1.67 looks like “miners are distributing well above normal.” In coin terms, nothing changed. The entire signal comes from the price rise.
Now a second day: miners send out 1,300 BTC at $100,000. USD outflow is $130 million, and the multiple is about 2.41. Part of that is real: 1,300 ÷ 900 ≈ 1.44 times the usual BTC amount. The rest is still price.
The fix is simple. Whenever you see a USD-based miner multiple, compute or chart the same ratio in BTC as well. If the BTC version is near 1 while the USD version is high, the “selling spike” is mostly a rally showing up in a dollar-denominated metric. A USD measure is still useful, since it reflects how much buying the market must absorb in dollars, but it answers a different question from “did miners change behavior?”
Reading the reserve, not just the flow
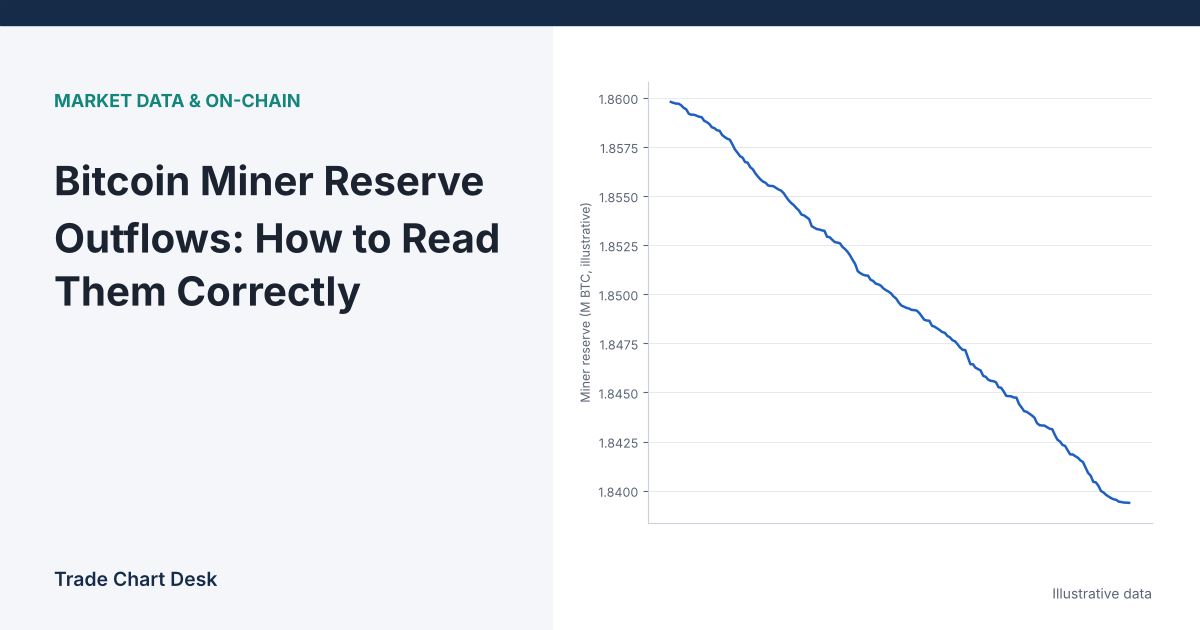
Outflow alone can mislead because miners also receive about 450 BTC a day plus fees. A better short summary is the change in reserve:
Reserve change ≈ coins received − coins sent out
Illustratively, if miners receive 455 BTC in a day (subsidy plus fees) and send out 600 BTC, the reserve falls by 145 BTC. They sold or moved their entire day’s production plus 145 BTC from stock. If they send out 400 BTC, the reserve grows by 55 BTC even though outflows were “large” in absolute terms. Over a week or month, a falling reserve tells you miners are drawing down stockpiles; a flat reserve with high outflow tells you they are simply passing production through, as usual.
When miner outflow data lies
Attribution is an estimate
Providers identify miner wallets through coinbase transactions and known pool addresses, then follow coins from there. Once coins pass through an intermediate wallet, an OTC desk or a custodian, attribution gets weaker. Different providers draw these boundaries differently, so their miner reserve figures will not match, and history can be revised.
Outflow is not a sale
CryptoQuant’s own documentation notes that miner outflows may reflect internal wallet transfers, coins moved for a later sale, or coins returning from an exchange to the miner. Pools also pay out to members routinely. Only part of any outflow reaches a market.
OTC sales are invisible as sales
Large miners often sell through OTC desks rather than on exchange order books. The coins leave the miner wallet, but the market impact is negotiated off-exchange. “Miner to exchange” flow can understate selling in some periods and overstate it when OTC desks route coins through exchange custody.
Public miners are a different dataset
Listed mining companies publish monthly production and sales updates and quarterly filings. Those reports can contradict what on-chain metrics suggest, because company treasury wallets may not be labelled as miner wallets at all. If a large public miner reports holding all of its production, that is better evidence about that company than any on-chain estimate.
Miners can be wrong too
Even when miner selling is real, it reflects a business decision about cash needs, not a forecast. Miners sell into tops and bottoms alike when bills come due, especially around halvings, when revenue per block drops overnight.
A routine for checking a “miners are selling” claim
- Find the unit. Is the chart in BTC or USD? If USD, open the BTC version.
- Compare with production. Is daily outflow above roughly 450 BTC plus fees for several days, and is the reserve actually falling?
- Check where coins went. Look at miner to exchange flow. Outflows to unlabeled wallets are a weaker sign than outflows to exchanges.
- Check the size. At an illustrative $100,000 price, an extra 150 BTC a day is $15 million. Compare that with daily spot volume from an aggregator; it is usually a small fraction.
- Cross-check the context. Has hashprice fallen sharply, or is a halving close? Do public miners’ latest monthly reports show increased sales?
- Look at the market’s other flows. Miner supply is one source among several. Exchange inflows from all holders and spot ETF flows are often much larger in dollar terms.
Testing whether it matters for your trading
If you want to use miner data, measure it on your own:
- Export daily miner outflow (BTC), miner to exchange flow (BTC) and the USD outflow multiple from one provider for several years.
- Compute your own BTC-based multiple: today’s outflow ÷ its 365-day average in BTC.
- Pick a threshold before you look at outcomes, for example a BTC multiple above 2.
- Record BTC returns over the next 7 and 30 days for every day above the threshold, and compare them with all other days. Repeat with the USD multiple and see how many of its signals simply coincide with rallies.
- Note how many independent episodes your sample contains. Ten days in one cluster is one event, not ten.
Keep the results in your trading journal. Most traders who do this end up treating miner data as background context for longer-term positioning rather than a trigger, which is roughly how the providers present it too.
Financial disclaimer: This article is for educational purposes only and is not financial, investment, or trading advice. Trading involves substantial risk of loss. Example figures are illustrative.
1 thought on “Bitcoin Miner Reserve Outflows: How to Read Them Correctly”