
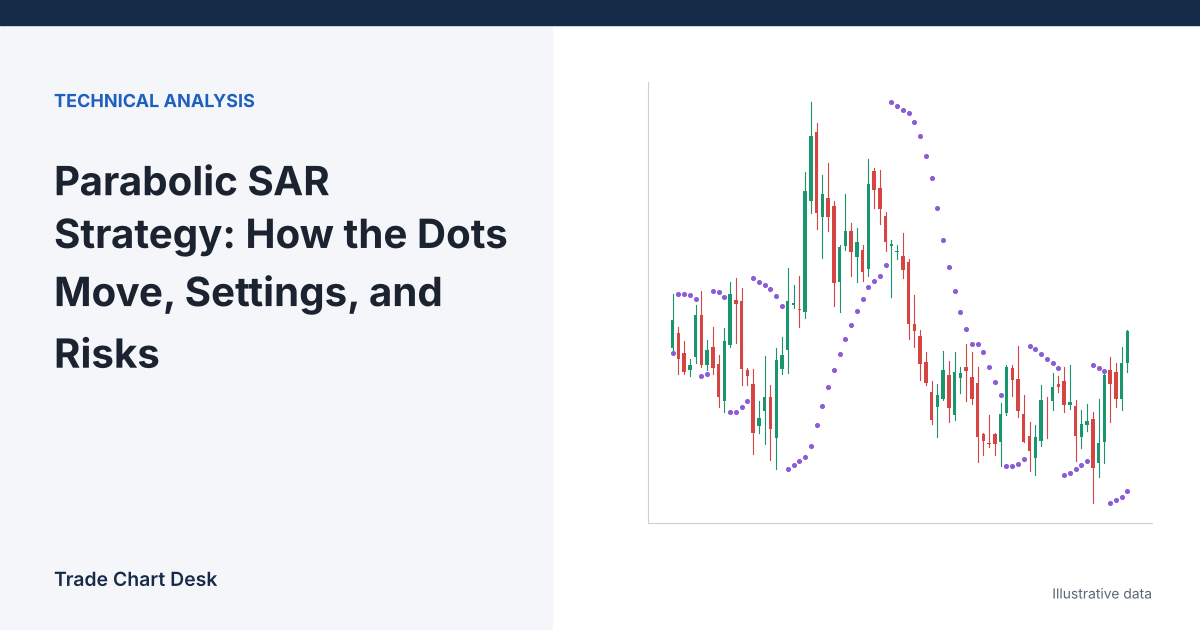
A common misconception about Parabolic SAR is that the dots are a support line that price “bounces off.” They are not. The dots are a stop level that moves toward price by a fixed fraction of the remaining gap every bar, and the fraction grows each time the trend makes a new extreme. Once you see it as a clock that speeds up, most of its behavior, good and bad, becomes predictable. This article works through eight bars of the calculation, shows what the three settings do to that clock, and lists the specific situations where it hurts.
Where it comes from and what the defaults are
J. Welles Wilder Jr. introduced Parabolic SAR (“stop and reverse”) in his 1978 book New Concepts in Technical Trading Systems, the same book that introduced RSI and ATR. Wilder designed it as an always-in-the-market system: when the stop is hit, you close and reverse. TradingView’s Parabolic SAR help page lists the standard inputs:
- Start (initial acceleration factor, AF): 0.02
- Increment (AF step): 0.02
- Maximum AF: 0.20
The calculation
For each new bar:
SAR(today) = SAR(yesterday) + AF × (EP − SAR(yesterday))
- EP (extreme point) is the highest high of the current uptrend, or the lowest low of the current downtrend.
- AF starts at 0.02 and rises by 0.02 each time a new EP is set, capped at 0.20. If no new extreme is made, AF stays where it is.
- Reversal: in an uptrend, if price trades below the SAR, the trend reverses. The first SAR of the new downtrend is the EP of the old uptrend (its highest high), and AF resets to 0.02.
- Non-penetration rule: in an uptrend, SAR may never be placed above the lows of the previous two bars. If the formula puts it there, the lower of those two lows is used instead. The mirror rule applies to highs in a downtrend.
With the defaults, AF goes from 0.02 to 0.20 in nine increments, so after nine new highs the stop is closing 20% of the gap to the extreme on every bar.
Eight bars of an uptrend, by hand
Illustrative 4-hour ETH/USDT bars. A downtrend has just reversed to up on bar 1; the lowest low of that downtrend was 2,400, so bar 1’s SAR is 2,400 and the first EP is bar 1’s high.
| Bar | High | Low | SAR | EP after bar | AF after bar |
|---|---|---|---|---|---|
| 1 | 2,520 | 2,450 | 2,400.00 | 2,520 | 0.02 |
| 2 | 2,580 | 2,500 | 2,402.40 | 2,580 | 0.04 |
| 3 | 2,640 | 2,560 | 2,409.50 | 2,640 | 0.06 |
| 4 | 2,630 | 2,590 | 2,423.33 | 2,640 | 0.06 |
| 5 | 2,700 | 2,610 | 2,436.33 | 2,700 | 0.08 |
| 6 | 2,690 | 2,620 | 2,457.43 | 2,700 | 0.08 |
| 7 | 2,660 | 2,580 | 2,476.83 | 2,700 | 0.08 |
| 8 | 2,600 | 2,540 | 2,494.69 | 2,700 | 0.08 |
Check bar 2: 2,400 + 0.02 × (2,520 − 2,400) = 2,402.40. Check bar 6: 2,436.33 + 0.08 × (2,700 − 2,436.33) = 2,457.43. Bar 4 made no new high, so AF stayed at 0.06. The SAR for bar 9 will be 2,494.69 + 0.08 × (2,700 − 2,494.69) = 2,511.11.
Notice what happens on bars 6 to 8. Price stalls and pulls back from 2,700, but the SAR keeps rising because the formula still moves it 8% of the way toward the old EP each bar. Price is falling and the stop is rising, so they meet quickly. That is the design: SAR assumes a trend that stops making progress is ending.
What the three settings change
Same eight bars, different inputs:
| Start / Increment / Max | SAR on bar 8 | Result |
|---|---|---|
| 0.01 / 0.01 / 0.20 | 2,451.10 | Still long, stop 89 below bar 8’s low |
| 0.02 / 0.02 / 0.20 (default) | 2,494.69 | Still long, stop 45 below bar 8’s low |
| 0.02 / 0.04 / 0.20 | 2,544.91 | Bar 8’s low of 2,540 is below SAR: reversed to short |
- Increment is the biggest lever. Doubling it to 0.04 made AF reach 0.14 by bar 6 and stopped the trade out during the pullback.
- Start controls how loose the stop is in the first few bars, when the trend is least confirmed.
- Maximum only matters in long, clean trends that make many new extremes. In this example AF never passed 0.08, so a lower maximum such as 0.08 would have produced identical numbers.
A practical way to use it: exit tool, not entry signal
Wilder’s always-in-the-market version flips every time the dots switch sides. In a crypto range, that means a stream of small losing reversals. Many traders instead use SAR only to manage exits on trades entered by another method:
- Enter on your own setup, for example a breakout and retest.
- Place the initial stop from your setup’s structure, not from SAR.
- Once the SAR rises above your initial stop, trail the stop to the SAR at each bar close.
- Exit when price trades through the SAR. Do not reverse.
Check the cost of a give-back before you trade it. If you had entered at 2,600 and trailed with default SAR, the stop for bar 9 would be 2,511.11, so a bar 9 exit at the stop would lose 88.89 per ETH from entry even though the trend reached 2,700. SAR protects you from riding a trend all the way back, but it does not lock in a fixed share of open profit.
For a comparison of SAR with ATR-based and structure-based trailing methods, see our guide to trailing stop-loss strategies.
Where Parabolic SAR breaks down
- Ranges. SAR has no volatility input and no way to recognise a range. It reverses at almost every swing, which is the most expensive environment for it.
- Slow, healthy trends. A trend that rises steadily but pauses for several bars at a time gets stopped out during the pauses, because the stop keeps moving while price does not.
- Volatility mismatch. SAR’s distance comes from the gap to the EP, not from ATR. After a single very large bar, the first SAR of a new trend can be far from price, and the reversal stop on a whipsaw is large.
- Wick-triggered reversals. Strict implementations reverse when the bar’s low (or high) crosses SAR, not the close. A long wick on one exchange can flip the dots. Know whether your platform’s alerts and your own rules use wicks or closes.
- Timeframe confusion. AF steps are per bar. The same settings tighten twelve times faster in clock time on a 5-minute chart than on an hourly chart.
Test it before you rely on it
- Recreate the table above in a spreadsheet using exported OHLC data (TradingView lets you export chart data on supported plans). If your numbers match the indicator on the chart, you understand it; if they differ by a bar, check where your platform starts the first trend.
- Compare SAR exits against a fixed ATR trailing stop on the same entries. Record average R per trade, not just win rate. Our Supertrend settings guide describes a volatility-based alternative.
- Run the default and one slower setting (for example 0.01 / 0.01 / 0.20) on at least two coins and two years. If one setting only looks better on one coin, that is noise.
Financial disclaimer: This article is for educational purposes only and is not financial, investment, or trading advice. Trading involves substantial risk of loss. Example figures are illustrative.