
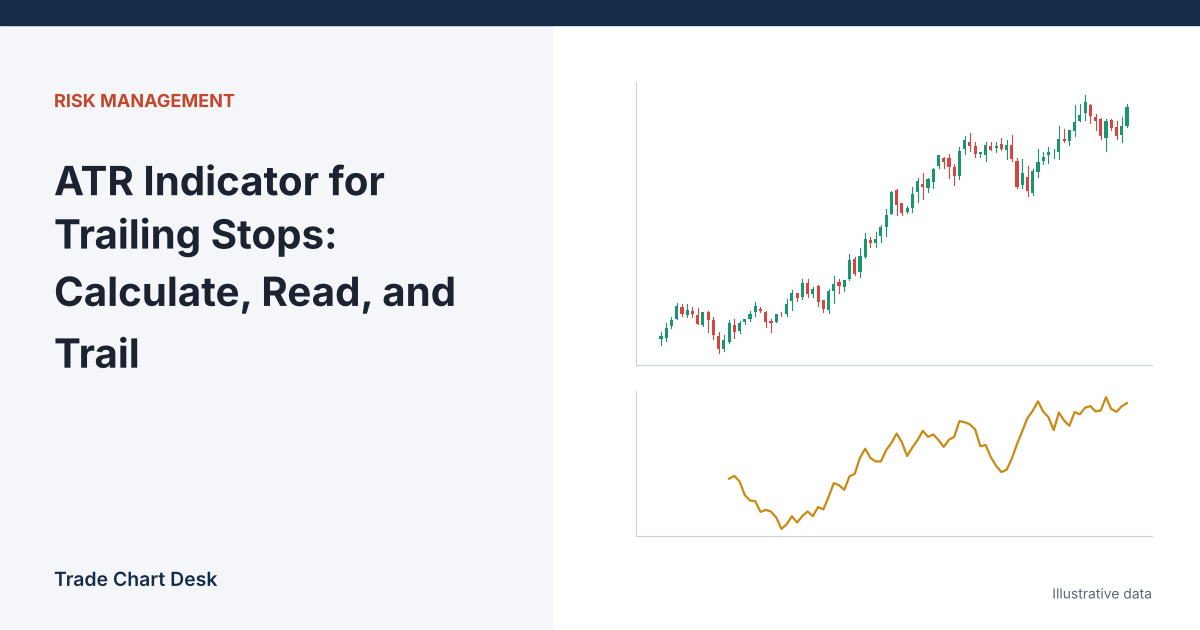
Your chart says BTC’s ATR(14) is 1,345. What does that number actually measure, why does it differ from the one in your spreadsheet, and how do you turn it into a stop that follows a winning trade without getting knocked out by ordinary noise? This guide builds Average True Range from the raw candles, shows how to read it, and then works through the trailing-stop math step by step.
True range: the largest of three distances
J. Welles Wilder introduced true range and ATR in his 1978 book New Concepts in Technical Trading Systems. A plain high-minus-low range ignores gaps, so Wilder defined the true range (TR) of a bar as the largest of:
- Current high − current low
- |Current high − previous close|
- |Current low − previous close|
Crypto trades around the clock, so true gaps are rarer than in stocks, but they still appear: on CME futures charts over weekends, on illiquid altcoins, and after exchange outages. Suppose the previous close was 63,500 and the next bar opens lower and trades only between 62,000 and 61,200. High − low is 800, but the move from the previous close down to the low is 2,300. TR is 2,300. A simple range would have understated the real movement by almost two-thirds.
Wilder smoothing, and why your spreadsheet disagrees with the chart
ATR is not a simple average of true range. Wilder used his own smoothing:
ATR today = (ATR yesterday × 13 + TR today) ÷ 14
That is the same as an exponential average with a weight of 1/14 on the newest bar. The very first value is seeded with a simple average of the first 14 true ranges. TA-Lib’s reference for Wilder’s smoothed moving average (RMA) spells out the seed and the recursion and notes that ATR is exactly RMA applied to true range. It also points out that a Wilder average of length N uses the same weight as an ordinary EMA of length 2N − 1, so ATR(14) reacts roughly like a 27-period EMA, not a 14-period one.
Three reasons your hand calculation may not match the chart:
- Different smoothing. Some platforms let you switch ATR to SMA or EMA smoothing. TradingView’s built-in ATR has a smoothing input that defaults to RMA (Wilder), as described in its ATR help page.
- Different starting point. Because each value depends on the one before, a series that starts 50 bars ago and one that starts 5,000 bars ago will differ slightly for a while.
- Different data. Each exchange has its own highs and lows. BTC/USDT on one venue and BTC/USD on another will produce different ATRs.
Four bars, worked by hand (illustrative daily BTC data)
Start with a previous close of 64,000 and a previous ATR of 1,200.
| Bar | High | Low | Close | TR | ATR(14) | ATR % of close |
|---|---|---|---|---|---|---|
| 1 | 64,800 | 63,500 | 64,300 | 1,300 | 1,207.1 | 1.88% |
| 2 | 65,200 | 64,100 | 64,900 | 1,100 | 1,199.5 | 1.85% |
| 3 | 66,900 | 65,100 | 66,700 | 2,000 | 1,256.7 | 1.88% |
| 4 | 66,500 | 64,200 | 64,600 | 2,500 | 1,345.5 | 2.08% |
Bar 1: (1,200 × 13 + 1,300) ÷ 14 = 1,207.1. Notice how slowly ATR moves. Bar 4 had a true range about double the previous ATR, yet ATR rose only about 7% (from 1,256.7 to 1,345.5). That lag is a feature for stop placement (it does not overreact to one wild candle) and a weakness when volatility changes regime quickly.
How to read ATR without fooling yourself
- ATR has no direction. Bar 3 was a strong up day and bar 4 a sharp down day, and both raised ATR. Rising ATR means bigger bars, not a bullish or bearish signal.
- Raw ATR is in price units. An ATR of 1,345 on BTC and 0.04 on a small altcoin cannot be compared. Divide by price to get ATR % (the last column). Comparing ATR % across coins, or across years on the same coin, tells you whether a market is truly calmer or just cheaper.
- Timeframe changes everything. A 1-hour ATR might be a fraction of the daily ATR. Always state the timeframe when you write down an ATR-based rule.
- Compare ATR to its own history. Is today’s ATR % near the low or high end of the last six months? Low readings often come before expansion, but ATR cannot tell you when or in which direction.
Turning ATR into a trailing stop
The most common ATR trailing rule is the Chandelier Exit, developed by Chuck LeBeau and popularised by Alexander Elder. For a long position:
Stop = highest high since entry − multiplier × ATR
LeBeau’s commonly cited defaults are a 22-bar lookback and a multiplier of 3. For a short, flip it: lowest low since entry plus multiplier × ATR. The rule that makes it a trailing stop is the ratchet: a long stop may move up or stay still, never down.
The ratchet in action (same four bars, multiplier 3)
Assume a long was opened before bar 1, and we use ATR(14) from the table for continuity.
- After bar 3: highest high 66,900. Stop = 66,900 − 3 × 1,256.7 = 63,129.9.
- After bar 4: highest high is still 66,900, but ATR rose to 1,345.5. Raw stop = 66,900 − 4,036.5 = 62,863.5.
- Because 62,863.5 is lower than the existing stop, the ratchet keeps the stop at 63,129.9.
Without the ratchet, a volatility spike would pull your stop further away right after a sharp drop, which is the opposite of what you want. Bar 4’s low of 64,200 stayed above 63,129.9, so the position survives. The open profit at risk is the distance from the highest high to the stop: 3 × ATR, roughly 3,770, or about 5.6% from the peak.
Choosing the multiplier
There is no correct multiplier, only a trade-off you should decide in advance:
| Multiplier | Behaviour | Typical fit |
|---|---|---|
| 1.5–2 × ATR | Hugs price, locks in more of each move, exits on ordinary pullbacks | Short holding periods, faster timeframes |
| 2.5–3 × ATR | Survives normal retracements, gives back more at the end | Swing trades in established trends |
| 3.5+ × ATR | Rarely triggered by noise, can give back a large share of the move | Long-horizon trend following |
The same ATR + multiplier logic powers Supertrend and Keltner Channels. If you want to see how an ATR trail compares with a moving-average trail or a structure-based trail on one identical trade, read our trailing stop methods comparison.
Where ATR trailing stops fail
- Sudden volatility jumps. ATR lags. A news candle can travel several ATRs in minutes, and your stop fills well below its trigger. Stop-market orders guarantee an exit, not a price.
- Choppy ranges. In a sideways market, a 2 × ATR trail gets tagged repeatedly. ATR stops assume a trend is worth riding.
- Wicks on one venue. A thin order book can print a wick that touches your stop on one exchange only. On futures, check whether your stop triggers on mark or last price; see mark vs. last vs. index price.
- Using a manual trail you forget to update. Exchange “trailing stop” orders usually trail by a fixed percentage or callback rate, not by ATR. If you want an ATR trail, you either update the stop yourself each bar close or use an alert-driven setup.
Check it on your own chart
- Export daily OHLC for one coin from your exchange or TradingView and compute TR and Wilder ATR in a spreadsheet using the formula above. Compare with the chart’s ATR after 100 or more bars; the values should converge.
- Add a Chandelier Exit indicator (several are public on TradingView) set to the length and multiplier you plan to use.
- Scroll back and record, for every trend you would have entered: entry, exit at the trail, the peak price reached, and the share of the peak move you kept. Do this for 2, 3, and 4 × ATR.
- Decide on one multiplier before you trade it. Your position size should come from the initial stop distance; our position sizing guide shows the formula.
Financial disclaimer: This article is for educational purposes only and is not financial, investment, or trading advice. Trading involves substantial risk of loss. Example figures are illustrative.
2 thoughts on “ATR Indicator for Trailing Stops: Calculate, Read, and Trail”