
Bitcoin pays no interest. That single fact is the starting point for every link between interest rates and crypto. When a risk-free US Treasury bill pays almost nothing, holding a volatile asset with no yield costs you very little in missed income. When the same bill pays 4%, every dollar in bitcoin is a dollar not earning that 4%, and every leveraged long has to beat a higher funding hurdle. Rates do not set the bitcoin price, but they change the price of waiting, borrowing and taking risk.
This article covers which rates matter, how to read what the market expects before a Federal Reserve decision, and how to put numbers on the rate effect for your own positions. If you want the release-day mechanics of inflation data, see our CPI guide; for the currency channel, see how the DXY affects bitcoin.
Where rates stand right now, and why that matters for this article
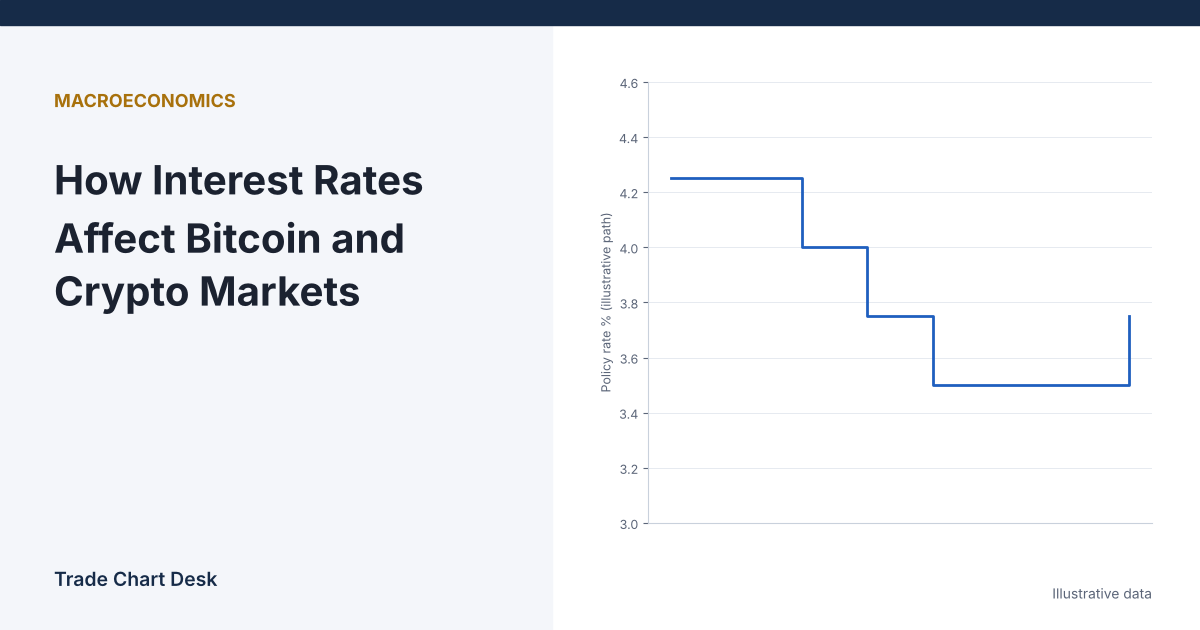
As of October 20, 2026, the Federal Open Market Committee’s target range for the federal funds rate is 3.75% to 4.00%. The Committee raised the range by a quarter point on September 16, 2026. Many crypto articles written in recent years assume the Fed is in a cutting cycle. That is no longer the starting point, so any rule of thumb built on “cuts are coming” needs rechecking.
The remaining 2026 FOMC meetings are October 27–28 and December 8–9 (the December meeting includes a Summary of Economic Projections). The Fed publishes the full schedule on its FOMC calendar page, and dates are tentative until confirmed at the preceding meeting. The September statement was released at 2:00 p.m. Eastern Time, the usual release time, followed by the Chair’s press conference.
Three rates, three different channels
| Rate | Where to see it | Channel to crypto |
|---|---|---|
| Federal funds rate (policy rate) | FOMC statements; effective rate on FRED (series EFFR) | Sets the floor for short-term dollar returns, including what money market funds and T-bills pay |
| Expected path of the policy rate | Fed funds futures; CME FedWatch | Markets move on changes in expectations, not on decisions that were already priced |
| 10-year real yield | FRED series DFII10 (10-year TIPS yield) | The inflation-adjusted return on a safe long-term asset; a common benchmark for long-duration risk assets |
These can move in different directions. The Fed can hold the policy rate while real yields jump because the market expects higher rates for longer. For a crypto trader, the second and third rows usually explain more day-to-day movement than the first.
Worked example 1: reading what the market expects
Fed funds futures (CME ticker ZQ) are priced as 100 minus the expected average effective fed funds rate for the contract month. CME’s FedWatch methodology article explains how its probabilities are derived from those prices. A simplified version, with illustrative numbers:
- Current effective rate: 3.88%.
- Futures contract for the month after the next meeting trades at 96.04, implying an average rate of 100 − 96.04 = 3.96%.
- Expected change: 3.96% − 3.88% = 0.08 percentage points.
- Implied probability of a 25 basis point hike: 0.08 ÷ 0.25 = 32%. Probability of no change: 68%.
The real FedWatch calculation adjusts for the meeting falling partway through a month, so its numbers will differ slightly from this shortcut. The point is what you do with the result: if the market prices a 32% chance of a hike, a hike is a partial surprise and a hold is a mild relief. If the market prices 95%, the decision itself is almost a non-event and the statement, projections and press conference become the news.
Write down the implied probability the day before each meeting. After the decision, record what was surprising. That record is far more useful than remembering which way bitcoin moved.
Worked example 2: the hurdle rate for holding or levering crypto
Rates also set a hurdle you can calculate. Illustrative figures:
- Bitcoin spot: $100,000. A futures contract expiring in 90 days: $101,500.
- Basis: $101,500 ÷ $100,000 − 1 = 1.5% over 90 days.
- Annualized (simple): 1.5% × 365 ÷ 90 ≈ 6.1%.
- T-bill yield: 3.9%.
A trader who buys spot and sells that future locks in about 6.1% annualized before fees, against 3.9% from T-bills. The 2.2-point gap is roughly what the market is paying for crypto-related risk and capital. When short rates rise, that gap tends to compress unless demand for leveraged longs pushes the basis up too. Our explainer on spot vs futures delta neutrality covers the mechanics, and perpetual futures show the same pressure through funding rates.
The same comparison applies to an unlevered holder. On $10,000, a 3.9% T-bill yield is $390 a year. That is the explicit cost of holding the same amount in bitcoin instead. When that number was close to zero, the opportunity cost of a speculative position was negligible. It is not negligible now.
Why the textbook story often fails
Priced in versus surprise
A “hawkish” hike that was 95% expected can be followed by a rally, because the uncertainty is gone. The direction of the rate change and the direction of the price reaction are not the same thing.
The statement and projections outweigh the decision
On meetings with a Summary of Economic Projections, the “dot plot” of officials’ expected rates can move markets more than the decision itself. A hold with higher projected rates can tighten conditions more than a hike that signals it is the last one.
Crypto-specific flows can dominate
ETF flows, regulatory decisions, exchange incidents and leverage unwinds regularly overwhelm macro effects for days or weeks. Spot ETF flows in particular can move more dollars in a day than a shift in rate expectations.
The relationship is not stable
Correlations between bitcoin and rate measures change sign over time. Any relationship you measure over one year may look different the next, especially across a shift from cutting to hiking.
Weekend gaps
Treasury markets close on weekends; bitcoin does not. A daily-data comparison that mixes weekend crypto moves with Friday yields will blur the relationship.
Measure it yourself
- From FRED, download DFII10 (10-year real yield) and DGS2 (2-year Treasury yield) daily. The 2-year tracks expected policy over the next couple of years better than the overnight rate does.
- Download BTC daily closes and keep only weekdays where Treasury data exists.
- Compute daily BTC returns and daily changes in each yield (in basis points, not percent changes).
- Calculate rolling 60-day correlations of BTC returns with each yield change, and chart them over several years. Note how often each flips sign.
- Build a meeting table: date, FedWatch probability the day before, decision, change in the 2-year yield from 1:55 p.m. to 4:00 p.m. ET, and BTC’s move over the same window and the next 24 hours.
After a year you will have eight meetings, which is a small sample, so treat the result as a description of how your market behaved rather than a rule. It is still more reliable than the claims you will see before the next meeting.
A pre-FOMC checklist
- Confirm the meeting date and whether it includes projections.
- Record the implied probability of each outcome.
- Note your open positions, leverage and liquidation prices; a 2:00 p.m. spike can reach levels that looked safe at noon. If you widen a stop for the event, cut size so dollar risk stays the same.
- Decide in advance whether you will hold through the statement and the press conference, or reduce beforehand.
- Afterwards, log what surprised the market: the decision, the projections, or the press conference.
Financial disclaimer: This article is for educational purposes only and is not financial, investment, or trading advice. Trading involves substantial risk of loss. Example figures are illustrative.