Ichimoku Cloud Breakout Strategy: Calculate It, Then Trade It

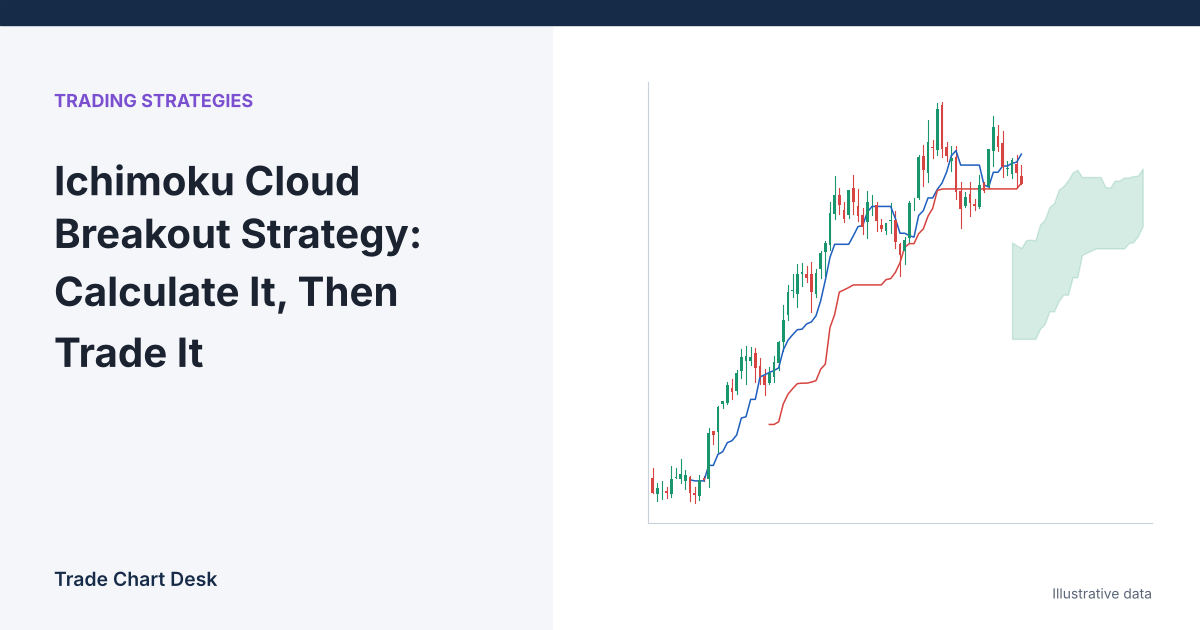
Illustrative chart for the article "Ichimoku Cloud Breakout Strategy: Calculate It, Then Trade It"

Most Ichimoku tutorials start with five Japanese names and a colored chart. This one starts with arithmetic, because once you have calculated the cloud by hand, the breakout rules stop being mysterious. You will see exactly why the cloud lags, why a “breakout” through a thin cloud means less than one through a thick cloud, … Read more

Stablecoin Dominance: How It Is Calculated and How to Read It

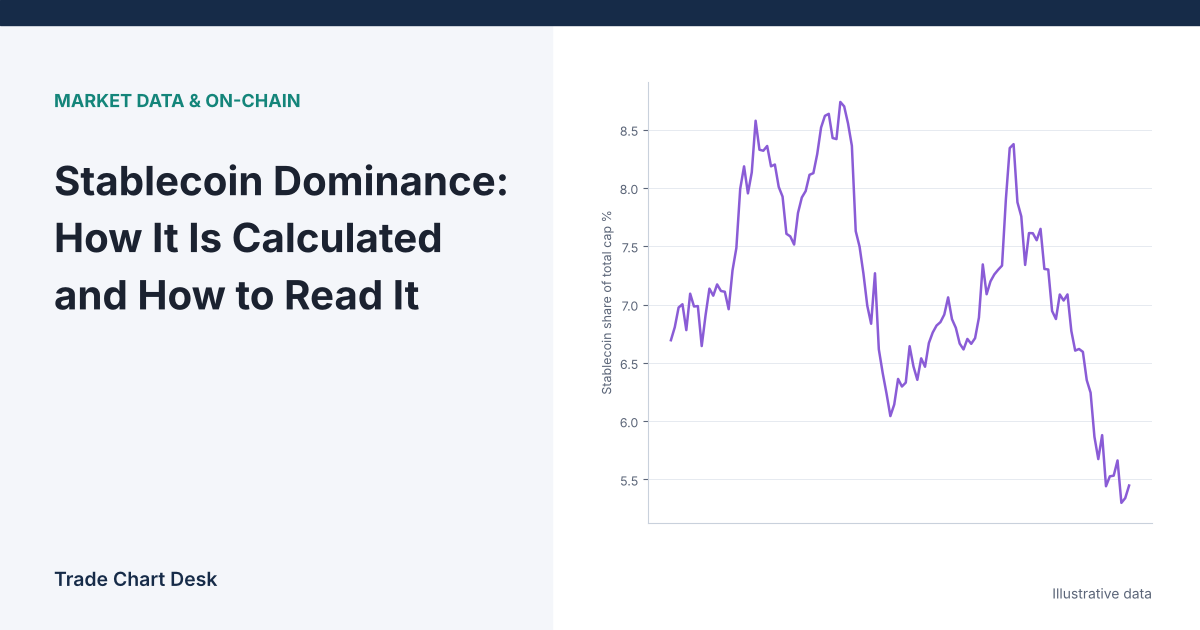
Illustrative chart for the article "Stablecoin Dominance: How It Is Calculated and How to Read It"

Here is a puzzle worth solving before you ever draw a trendline on a stablecoin dominance chart. Suppose not a single new stablecoin is minted and none are redeemed, yet stablecoin dominance rises from 10.0% to 12.2% in a week. Did traders “flee to stablecoins”? Not necessarily. Nothing about stablecoins changed at all. The rest … Read more

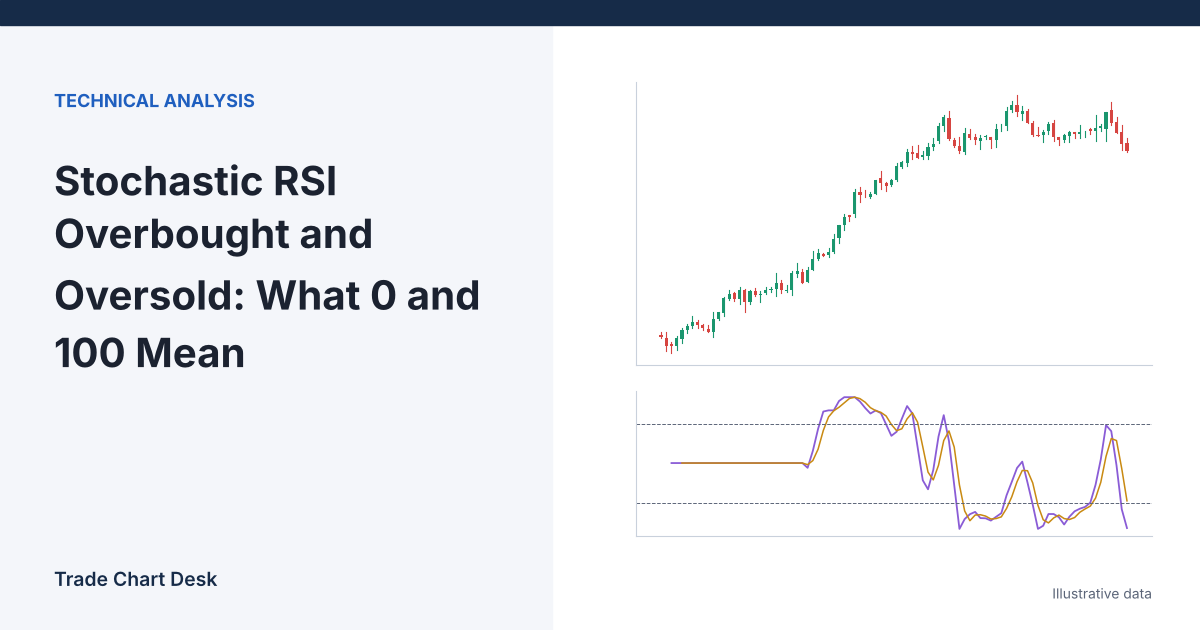
Stochastic RSI Overbought and Oversold: What 0 and 100 Mean

Illustrative chart for the article "Stochastic RSI Overbought and Oversold: What 0 and 100 Mean"

Here is a situation that confuses a lot of new traders. RSI reads 49.5, almost exactly neutral. On the same bar, Stochastic RSI reads 0, the most “oversold” value it can print. Both indicators are built from the same closes. How can one say “nothing special” while the other says “extreme”? The answer explains almost … Read more