Keltner Channels Explained: Calculation, Settings, vs Bollinger

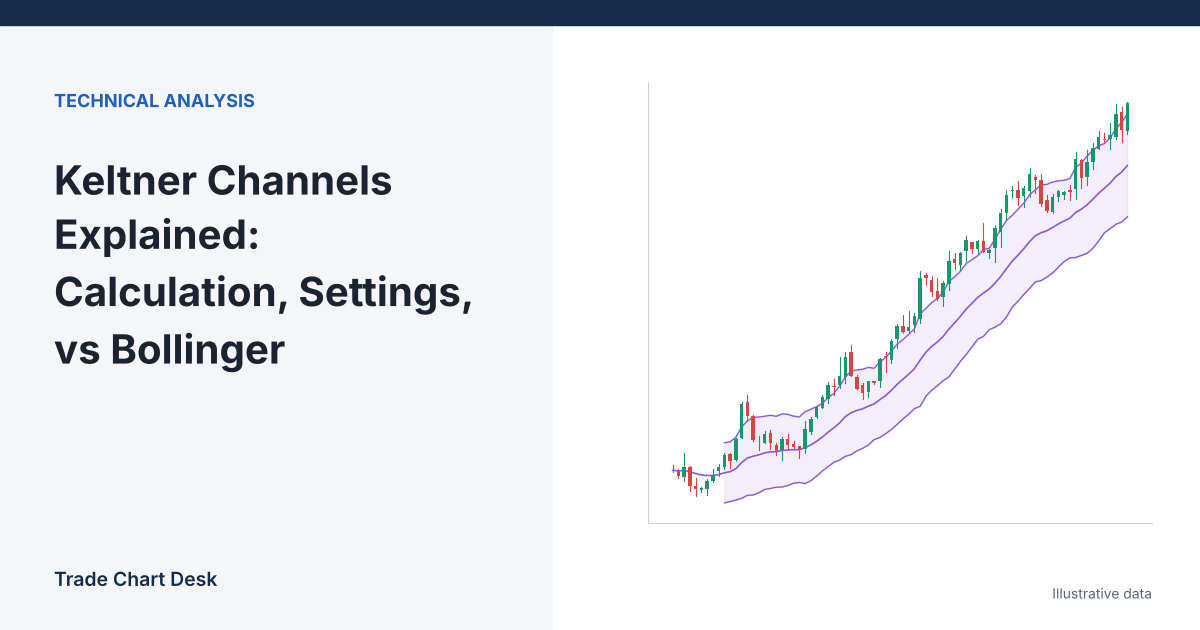
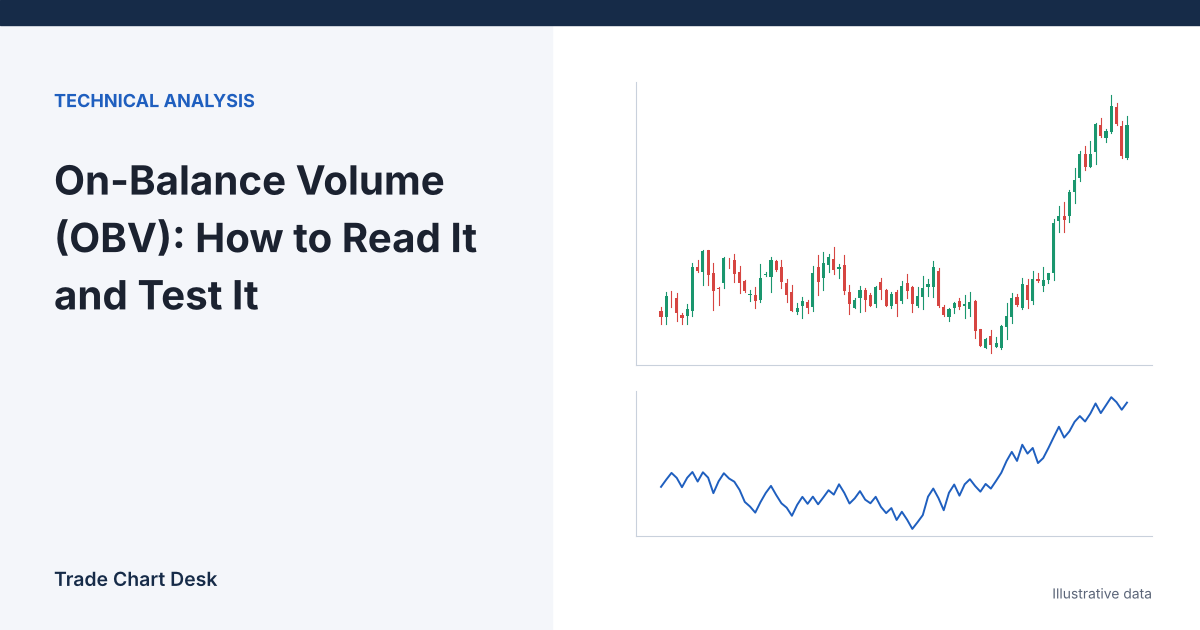
Illustrative chart for the article "Keltner Channels Explained: Calculation, Settings, vs Bollinger"

Put Keltner Channels and Bollinger Bands on the same chart and they often look almost identical: a middle line with an envelope above and below. Then a single large candle prints, and the two react completely differently. Bollinger Bands balloon outward; the Keltner Channel barely widens. That difference is the whole reason to know both, … Read more

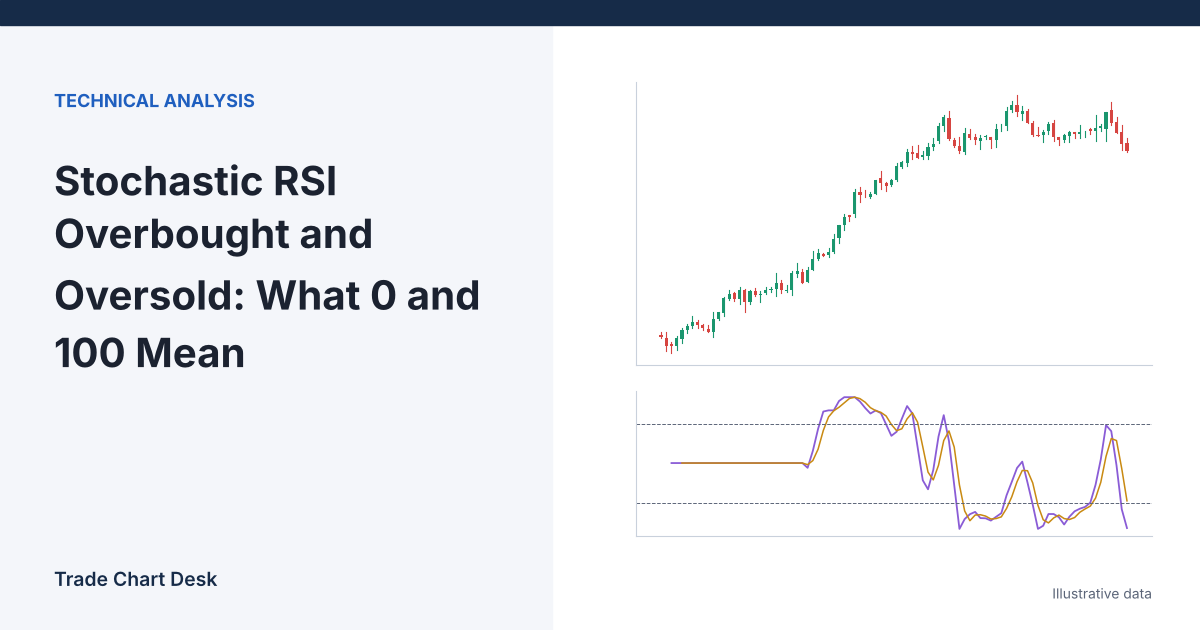
Stochastic RSI Overbought and Oversold: What 0 and 100 Mean

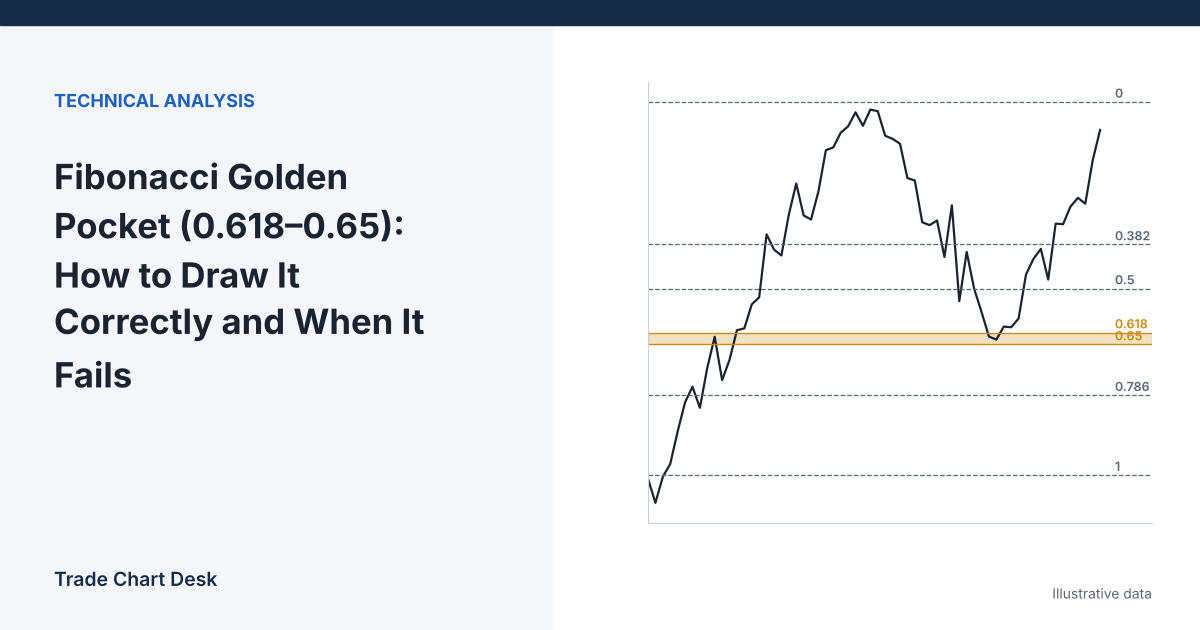
Illustrative chart for the article "Stochastic RSI Overbought and Oversold: What 0 and 100 Mean"

Here is a situation that confuses a lot of new traders. RSI reads 49.5, almost exactly neutral. On the same bar, Stochastic RSI reads 0, the most “oversold” value it can print. Both indicators are built from the same closes. How can one say “nothing special” while the other says “extreme”? The answer explains almost … Read more